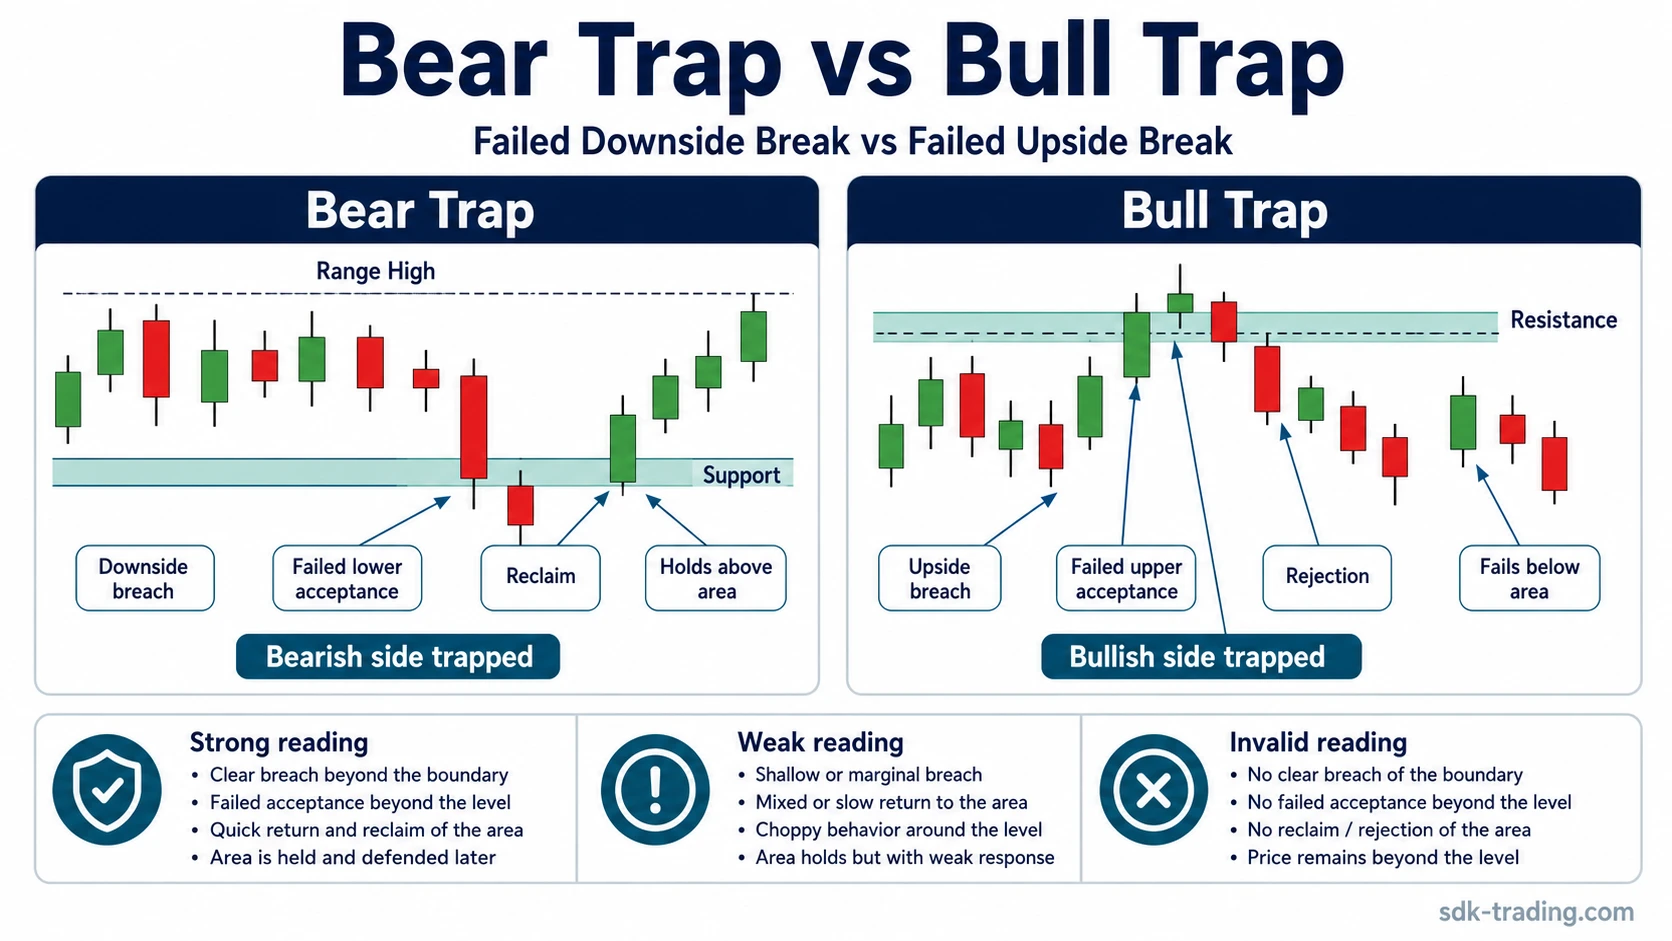
Bear trap vs bull trap separates two opposite false-break structures: a bear trap begins with a failed downside break below support that reclaims the level, while a bull trap begins with a failed upside break above resistance that rejects back below the level.
Both patterns involve a market moving beyond a visible boundary and then failing to accept there. The difference is the direction of the failed move, the boundary being tested, and the side of the market that becomes trapped.
A bear trap pressures sellers who act on a downside breakdown. A bull trap pressures buyers who act on an upside breakout. The first break creates the question, but the return through the boundary and the follow-up around that area determine whether the trap reading is clean, weak, or invalid.
Key Points
- A bear trap is built around a failed downside break below support and a reclaim back above that area.
- A bull trap is built around a failed upside break above resistance and a rejection back below that area.
- The trapped side is different: bear traps catch sellers, while bull traps catch buyers.
- A wick through a level is only an early clue; failed acceptance and later structure decide the quality of the reading.
Bear Trap vs Bull Trap: The Core Difference
The core difference is directional. A bear trap tests the downside of a support area, fails to hold below it, and then returns above the broken boundary. A bull trap tests the upside of a resistance area, fails to hold above it, and then returns below the broken boundary.
The names can feel reversed because the trap label describes who is trapped, not the direction of the first move. In a bear trap, bearish sellers are caught after downside continuation fails. In a bull trap, bullish buyers are caught after upside continuation fails.
Definition: A bear trap is a failed downside breakdown that reclaims a support boundary. A bull trap is a failed upside breakout that rejects from a resistance boundary.
Quick Comparison Table
The comparison is clearest when the same criteria are applied to both structures. Direction alone is not enough; the boundary, acceptance, trapped side, and later response must line up.
| Criteria | Bear Trap | Bull Trap |
|---|---|---|
| Boundary tested | Support or a prior downside reference area | Resistance or a prior upside reference area |
| Initial false move | Price trades below support | Price trades above resistance |
| Failed acceptance | Price cannot remain accepted below support | Price cannot remain accepted above resistance |
| Return behavior | Price reclaims the broken support area | Price rejects back below the broken resistance area |
| Trapped side | Sellers who expected downside continuation | Buyers who expected upside continuation |
| Clean reading | Clear support, downside breach, failed lower acceptance, reclaim, and later defense above the level | Clear resistance, upside breach, failed upper acceptance, rejection, and later failure to regain the level |
| Weak reading | Only a brief lower wick, unclear support, or immediate chop around the level | Only a brief upper wick, unclear resistance, or immediate chop around the level |
| Invalid reading | Price accepts below support and continues to build structure beneath it | Price accepts above resistance and continues to build structure above it |
Why the Two Patterns Are Confused
Bear traps and bull traps are confused because both begin with a boundary break that looks actionable at first glance. A breakdown below support can look like fresh weakness. A breakout above resistance can look like fresh strength. In both cases, the trap reading becomes more defensible only when the market fails to stay beyond the broken level.
The practical distinction is whether the market accepted beyond the line, returned through it, and then behaved in a way that made the first break unreliable.
Reading note: The breakout or breakdown only starts the test. The follow-up around the boundary determines whether the first break remains suspect.
How a Bear Trap Forms
A bear trap usually starts with a visible support area that traders can recognize. Price then moves below that area, making downside continuation appear possible.
The reading changes when the market cannot stay below the broken support. If price reclaims the level and later holds above it, the original breakdown becomes suspect because sellers who acted on the move may now be positioned on the wrong side of the reclaim.
A cleaner bear-trap reading needs more than a lower wick. The level should be visible, the downside break should be clear, and the market should show that lower prices were not accepted. If price remains below the broken support and builds structure there, the bear-trap label becomes weak or invalid.
How a Bull Trap Forms
A bull trap begins around a visible resistance area. Price moves above that area, making upside continuation appear possible.
The reading shifts when price cannot remain above the breached resistance. A rejection back below the level can leave breakout buyers exposed, especially if later recovery attempts fail to regain the area.
A cleaner bull-trap reading needs a clear resistance boundary, an upside breach, failed acceptance above the level, and later behavior that supports the rejection. If price accepts above resistance and continues to hold there, the bull-trap reading loses its basis.
Same Boundary, Opposite Trap Reading
A range can rotate between a visible support area and a visible resistance area before either side produces a failed break. The same range can produce a bear-trap reading near the lower boundary or a bull-trap reading near the upper boundary.
Example of a Basic Trap Reading: Price trades below the lower boundary of a range, but sellers cannot keep it there. The market returns above support and later pullbacks fail to push back below the broken area. That behavior supports a bear-trap reading because downside acceptance failed.
In the opposite case, price trades above the upper boundary of the same range, but buyers cannot keep it there. The market falls back below resistance and later attempts to regain the level stall. That behavior supports a bull-trap reading because upside acceptance failed.
The example is not about predicting what follows. It separates two labels that depend on opposite boundary failures: failed lower acceptance for a bear trap and failed upper acceptance for a bull trap.
Clean, Weak, and Invalid Readings
A trap label becomes cleaner when the chart shows a sequence, not just a single mark through a level. The sequence usually needs a visible boundary, a break beyond it, failed acceptance, a return through the boundary, and later behavior that does not immediately contradict the reading.
| Reading quality | What it means | Bear trap clue | Bull trap clue |
|---|---|---|---|
| Clean | The boundary and failed acceptance are both visible. | Price breaks support, reclaims it, and later holds above the area. | Price breaks resistance, rejects below it, and later fails to regain the area. |
| Weak | The trap idea is possible, but evidence is thin or noisy. | A small lower wick appears below a vague support area. | A small upper wick appears above a vague resistance area. |
| Invalid | The market accepts beyond the breached boundary instead of rejecting it. | Price remains below support and treats the old level as resistance. | Price remains above resistance and treats the old level as support. |
How This Differs From Swing Failure
Trap readings and swing-point failures can overlap, but they are not identical. A trap reading focuses on failed acceptance beyond support or resistance and on the participant group caught by that failure. A swing failure pattern focuses more narrowly on a prior swing high or swing low being taken and then rejected.
The bridge between them is failed acceptance. The difference is framing: bear trap vs bull trap compares opposite false-break structures, while swing failure describes how a specific swing point fails to hold after being breached.
Common Misreads
A common misread is labeling every failed breakout or failed breakdown as a trap. Some breaks fail because the level was weak, the range was poorly defined, or the market stayed noisy around the boundary. A trap reading needs a visible area and a sequence that makes the initial break look unreliable.
Another mistake is treating one wick as enough. A wick can show rejection, but it does not show the whole sequence. The later response around the broken level is what separates a possible trap from normal volatility around support or resistance.
Volume, momentum, and candle shape can support the reading, but they do not prove it by themselves. The main question remains structural: did price accept beyond the boundary, or did it return and behave as if the break failed?
Limitation: A clean label is easier after the sequence develops. Early labeling is more fragile because acceptance, rejection, and later behavior may still be unresolved.
FAQ
What is the main difference between a bear trap and a bull trap?
A bear trap is a failed downside break below support that reclaims the level. A bull trap is a failed upside break above resistance that rejects back below the level.
Who gets trapped in a bear trap?
Sellers can become trapped in a bear trap when they act on a downside breakdown and the market later reclaims the broken support area.
Who gets trapped in a bull trap?
Buyers can become trapped in a bull trap when they act on an upside breakout and the market later rejects back below the broken resistance area.
Is one wick enough to identify a bear trap or bull trap?
One wick is not enough for a clean reading. A stronger reading needs a visible boundary, a break, failed acceptance, a return through the level, and later behavior that supports the rejection or reclaim.
Can a failed breakout still be valid instead of becoming a bull trap?
Yes. If price accepts above the broken resistance and continues to hold above it, the bull-trap reading weakens or becomes invalid because the market did not reject the breakout area.