A false breakout develops when price moves beyond a meaningful trading boundary but fails to establish sustained acceptance outside it. The initial break starts the sequence. The failed hold, return, or later retest determines whether that breakout attempt should be reclassified.
Definition: A false breakout is a failed attempt to establish price beyond support, resistance, a range edge, a swing level, or another defined boundary. Price trades outside the structure, but later behavior shows that the new area was not maintained.
Core boundary: crossing back through a level once does not automatically create a false breakout. The defining issue is whether the market failed to establish acceptance beyond a boundary that was meaningful before the break occurred.
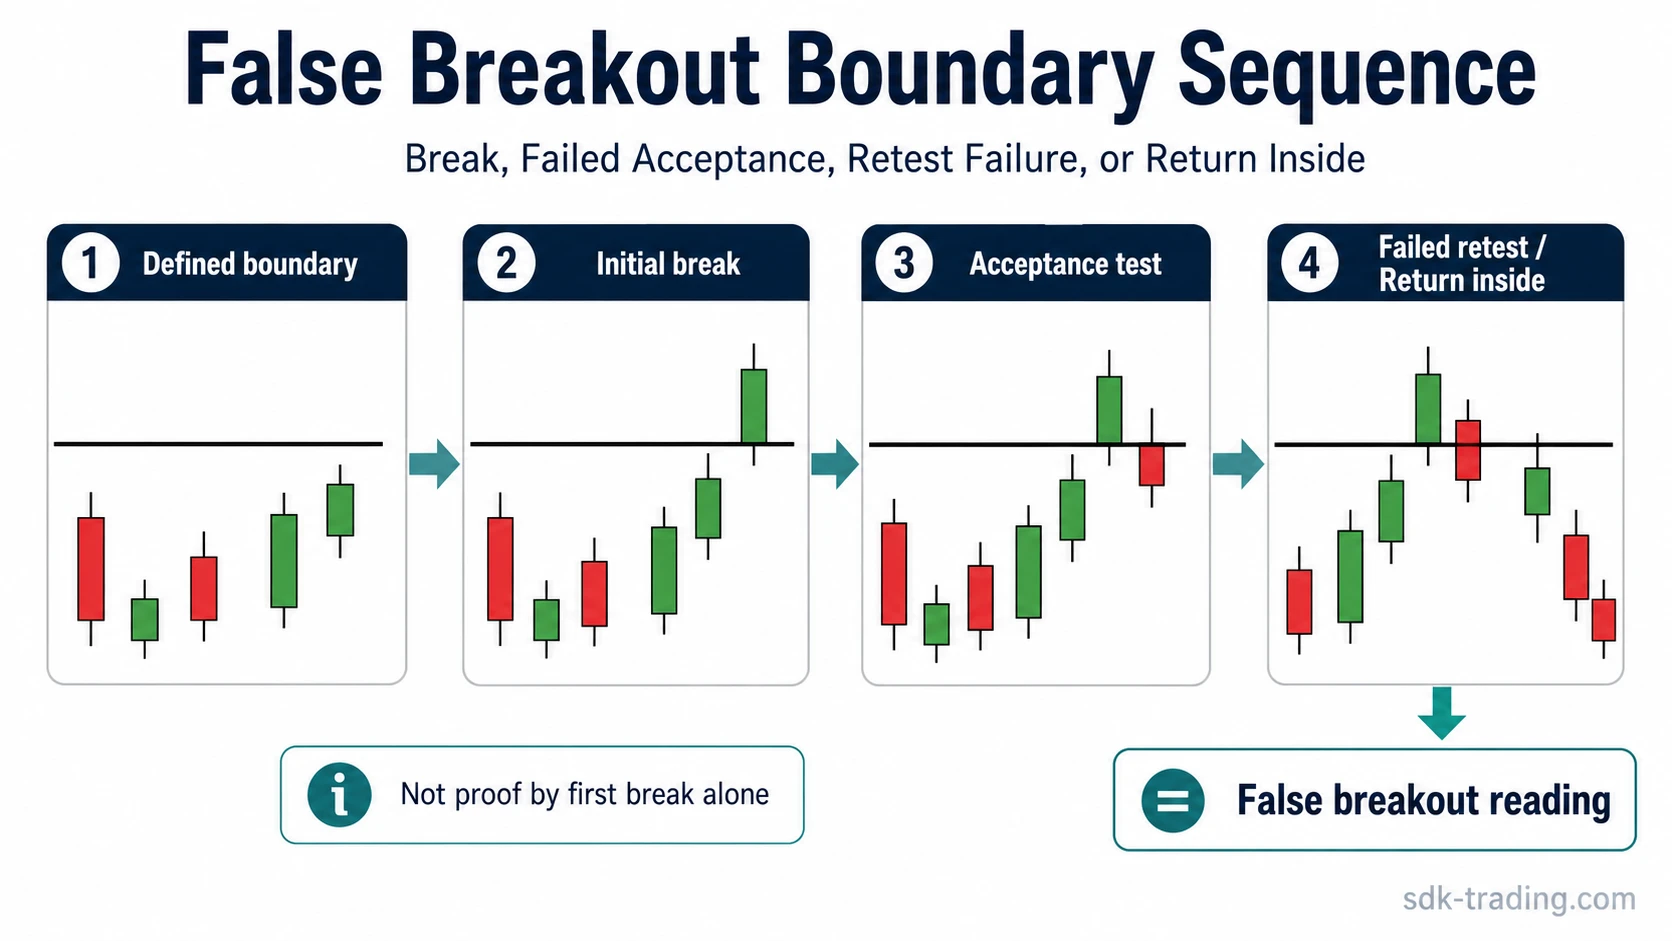
How a False Breakout Develops
False breakout analysis begins before price crosses the level. The boundary must already exist as part of the visible structure.
| Stage | Price behavior | Structural question |
|---|---|---|
| 1. Defined boundary | Support, resistance, a range edge, swing level, or another visible reference already exists. | Was the boundary meaningful before the breakout? |
| 2. Initial break | Price trades beyond the boundary. | Is the market beginning to establish itself outside? |
| 3. Acceptance test | Price either holds beyond the level or begins losing the outside area. | Can the breakout maintain the new side? |
| 4. Failure | Price returns through the boundary, loses a retest, or otherwise fails to preserve the outside structure. | Has the original breakout interpretation weakened? |
| 5. Reclassification | The initial break is interpreted using the later evidence. | Is the structure now an accepted breakout, false breakout, or still unresolved? |
False breakout and fake breakout are often used as broad practical synonyms. False breakout is useful as a structural term because it describes observable failure rather than assuming why market participants moved price beyond the level.
Breakout vs False Breakout
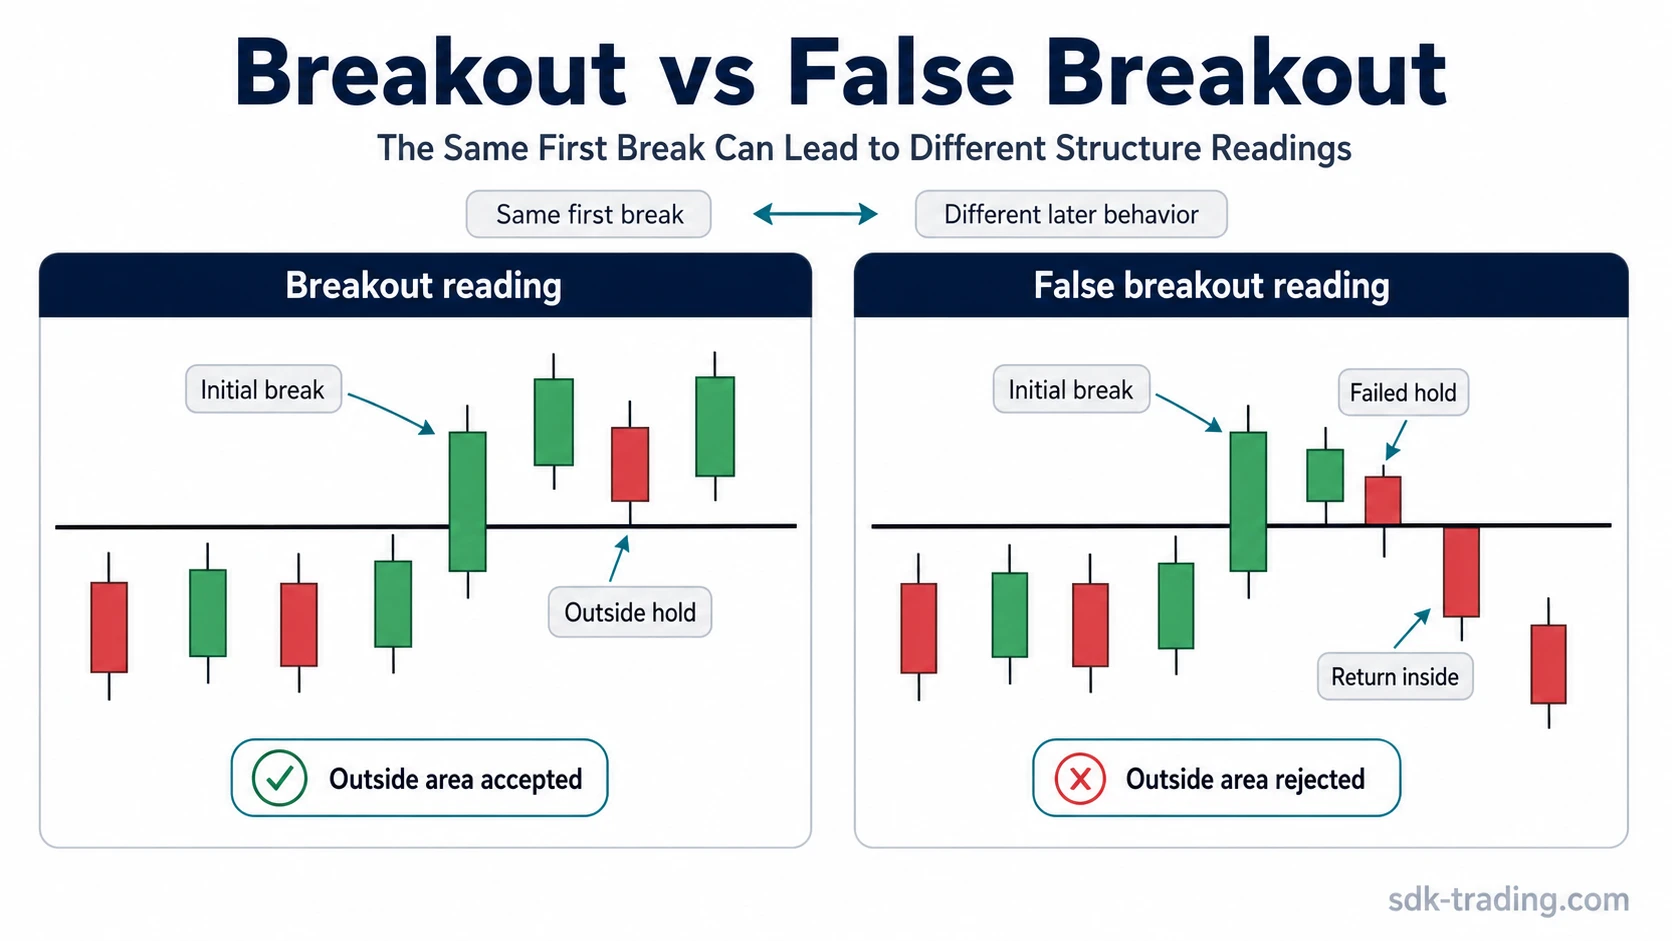
A successful breakout and a false breakout can begin with almost identical price movement. The difference appears after the boundary has been crossed.
| Feature | Accepted breakout | False breakout |
|---|---|---|
| Initial break | Price moves beyond a defined boundary. | Price also moves beyond a defined boundary. |
| Outside behavior | Price continues establishing itself beyond the old level. | Price struggles to maintain the outside area. |
| Follow-through | Later movement supports continuation. | Continuation stalls, weakens, or reverses. |
| Return test | The old boundary can hold from the new side. | The new side fails to hold or price returns through the boundary. |
| Classification | The breakout remains consistent with the developing structure. | The breakout attempt is weakened or rejected by later behavior. |
See Breakout and False Breakout Behavior on Real Charts
This section of the stock-chart walkthrough shows why the first move through a boundary is not enough to classify the structure. The hold, retest, follow-through, or return through the level provides the later evidence.
The practical distinction is whether the market can remain outside the previous structure after the break.
Wick, Close, and Outside Acceptance
A wick through a boundary shows only that price traded beyond it during the candle. It does not classify the move as either a successful breakout or a false breakout.
A close outside represents a more developed breakout attempt, but it still does not settle the structure. Price can close beyond a level and then immediately lose the new area.
| Behavior | What it establishes | What remains open |
|---|---|---|
| Wick beyond boundary | Price temporarily traded outside. | Whether any lasting acceptance develops. |
| Close beyond boundary | The breakout attempt survived through the candle close. | Whether later price can maintain the outside area. |
| Repeated trading outside | Acceptance is becoming more established. | Whether later retests preserve the structural change. |
| Return through boundary | The outside area has lost at least part of its acceptance. | Whether the move becomes a clear false breakout or remains unresolved. |
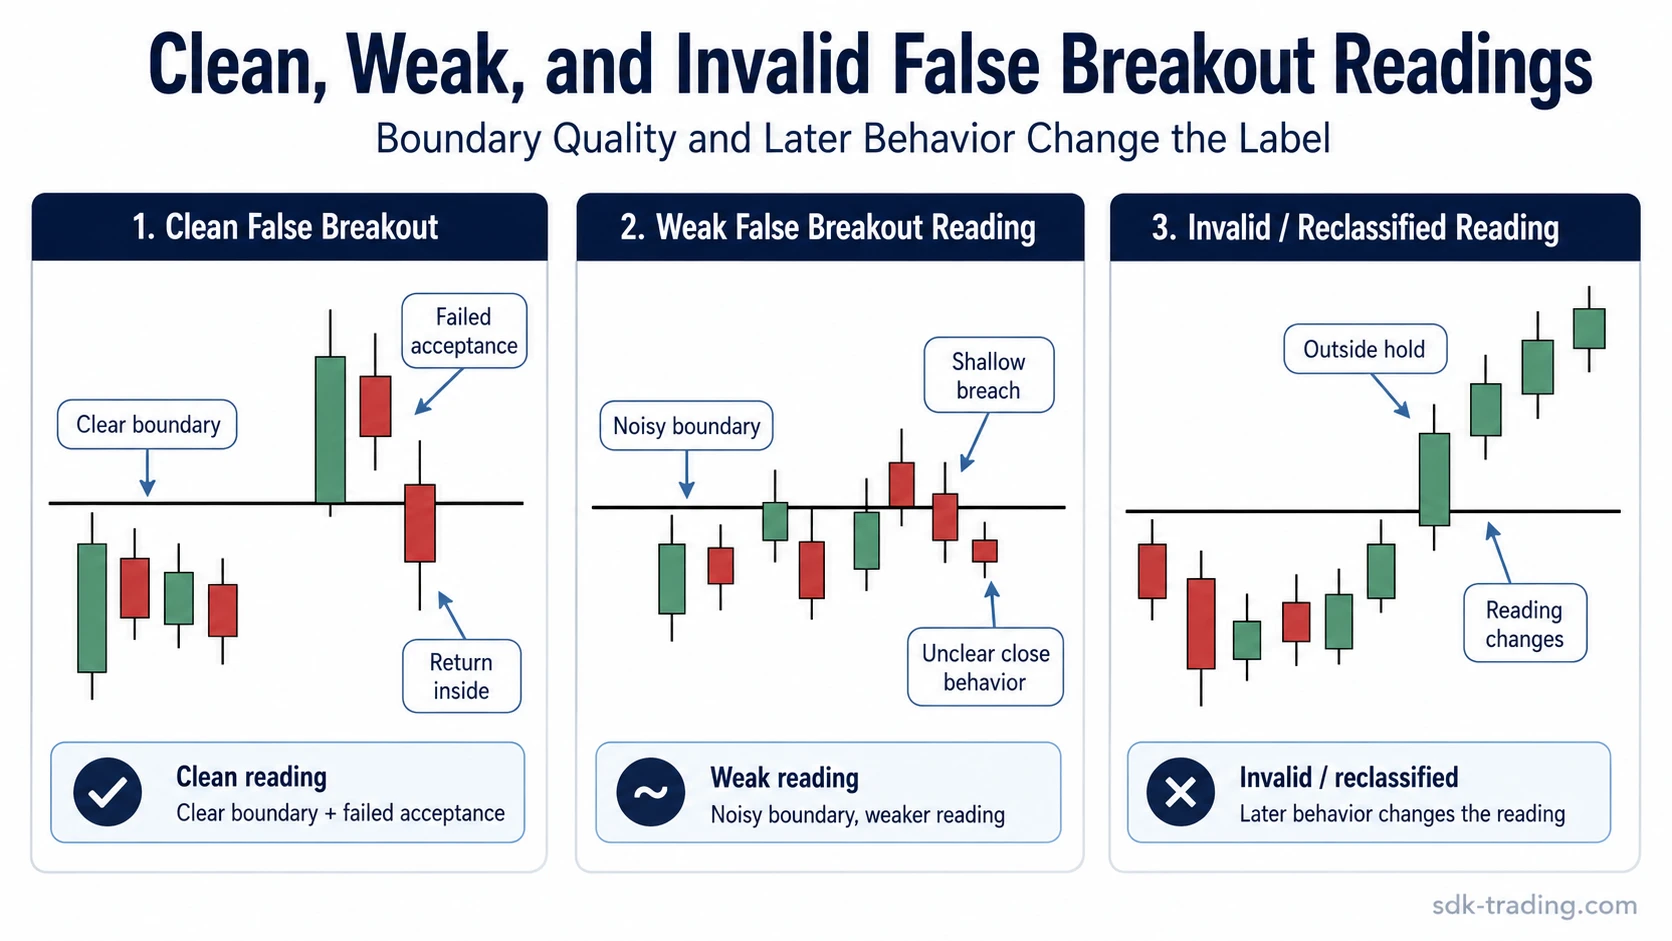
Clean, Unresolved, and Invalid False Breakout Readings
| Reading | Typical structure | What separates it |
|---|---|---|
| Clean false breakout | Clear prior boundary, identifiable break, failed outside acceptance, and return through the boundary or failed retest. | The later structure directly contradicts the original breakout interpretation. |
| Unresolved | Price crosses the boundary but neither establishes the outside area nor clearly rejects it. | The structure has not developed enough evidence for a clean classification. |
| Invalid false-breakout reading | Price continues holding outside or repeatedly preserves the new side during retests. | The market is building acceptance beyond the boundary, so the earlier false-breakout thesis should be discarded. |
False Breakout vs Related Structures
False breakout is a broad boundary-failure concept. More specific setups can contain similar behavior while answering a narrower structural question.
| Concept | Main distinction |
|---|---|
| False breakout | A move beyond any meaningful boundary fails to establish sustained acceptance. |
| Fakey pattern | A more specific false-break structure built around an inside-bar or mother-bar range. |
| Flip zone | The focus is whether an earlier support, resistance, supply, or demand area begins functioning from the opposite side. |
Interpretation Limit
A false breakout describes failed acceptance around a boundary. It does not determine what price must do next.
Core limit: rejection of a breakout is not the same as confirmation of a reversal. Price can return inside the previous structure and remain range-bound, unresolved, or develop another setup.