A broadening wedge pattern is a chart structure where price swings expand between two sloping boundaries instead of narrowing into a tighter range. The wedge-like part comes from the directional slope of the structure; the broadening part comes from higher volatility, wider swings, and increasing separation between the boundary lines.
A clean broadening wedge reading depends on visible structure, not on the pattern name alone. The label is stronger when swing highs and swing lows expand, both boundaries receive repeated reactions, and the lines can be drawn without forcing the chart to fit the idea.
Broadening Wedge Pattern Key Points
- A broadening wedge begins narrower and becomes wider as swings expand.
- The boundaries should slope coherently rather than form a flat or random volatile range.
- Ascending and descending versions are variants, not separate proof that price must move in one direction.
- A weak label usually comes from forced lines, poor touch count, or a swing sequence that does not actually expand.
- Confirmation behavior can improve the reading, but it does not turn the structure into a standalone trading signal.
What Is a Broadening Wedge Pattern?
A broadening wedge pattern is a technical-analysis structure built from expanding price swings inside two sloping boundaries. Price usually starts in a tighter area, then begins making wider moves as each reaction travels farther from the prior swing range.
The structure is different from a narrowing wedge because the distance between the boundaries increases over time. It is also more specific than a broad volatile range because the boundaries still need a readable directional bias and repeated reactions.
The pattern name should stay secondary to chart evidence. If swings stop expanding, boundary logic breaks, or another structure explains the chart more accurately, the reading should be revised instead of defended.
How a Broadening Wedge Forms
A broadening wedge forms when each side of the market reaches farther than the previous reaction while the overall structure keeps a directional slope. That creates a range that widens as the sequence develops.
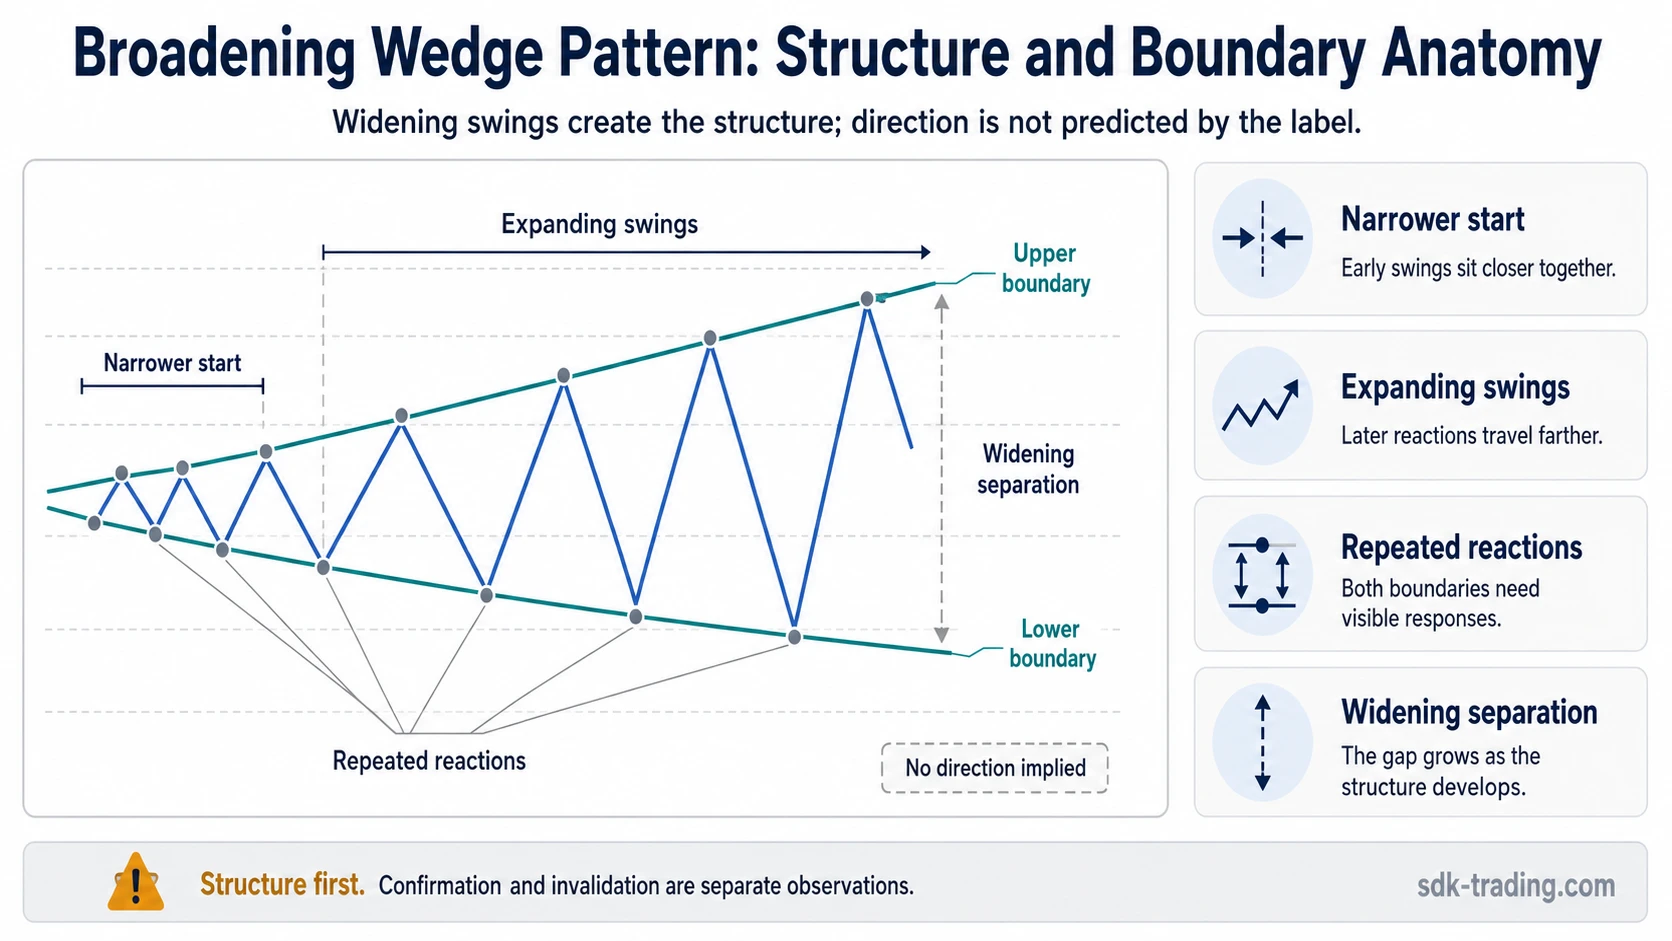
| Structural feature | What to look for | Why it matters |
|---|---|---|
| Narrower start | Early swings are closer together. | The pattern needs visible expansion from an earlier, tighter area. |
| Expanding swing highs and lows | Later reactions push farther beyond earlier swing points. | The broadening label depends on widening movement, not only volatility. |
| Two sloping boundaries | Upper and lower lines can be drawn across repeated reactions. | The wedge reading needs coherent boundary behavior. |
| Repeated boundary reactions | Price responds more than once near each side of the structure. | Touch count separates a real structure from a forced drawing. |
| Widening separation | The gap between the boundaries grows as the structure matures. | Without widening separation, the chart may be a channel, range, or narrowing wedge instead. |
The best diagnostic question is simple: does the chart show widening swing behavior between coherent sloping boundaries, or does the label require the line to be forced across unrelated highs and lows?
How to Identify a Broadening Wedge
Identification starts with swing structure before any bullish or bearish interpretation. A broadening wedge is not confirmed by one sharp move, one boundary touch, or a single breakout beyond a line.
Broadening Wedge Identification Checklist:
- Does the structure begin narrower and become wider?
- Are swing highs, swing lows, or both expanding as the pattern develops?
- Can the upper and lower boundaries be drawn without ignoring obvious reactions?
- Do both boundaries receive repeated tests or reactions?
- Do the boundaries slope in a coherent wedge direction rather than forming a random range?
- Does the chart still fit after comparing it with broadening formation, megaphone, narrowing wedge, and variant structures?
A clean reading usually has enough touch points to make the boundary visible without creative line drawing. A weak reading often appears when the chart is volatile, but the swing sequence does not create a defensible expanding structure.
The Diagnostic Boundary: What Makes the Label Defensible
The diagnostic boundary is the difference between a visible broadening wedge and a pattern name placed on a noisy chart. The label is defensible only when the boundary lines explain repeated price reactions and the swing sequence expands between them.
| Question | Defensible broadening wedge | Weak or forced reading |
|---|---|---|
| Do the swings expand? | Later swings travel beyond earlier swing extremes. | Price is simply choppy, wide, or inconsistent. |
| Do the boundaries explain reactions? | Both sides show repeated responses near the lines. | The line connects isolated points and ignores better structure nearby. |
| Does the slope make sense? | The boundaries have a coherent directional bias. | One or both lines are adjusted mainly to preserve the label. |
| Does the label survive comparison? | The structure remains wedge-like after checking nearby pattern families. | A megaphone, broadening formation, channel, or narrowing wedge explains the chart better. |
The broadening wedge label should change when later swing evidence invalidates the earlier reading. That can happen when expansion disappears, boundary reactions stop mattering, or the structure resolves into a better-fitting neighboring pattern.
Clean, Weak, and Invalid Broadening Wedge Readings
Broadening wedge quality is not all-or-nothing. Some structures are clean enough to label, some are only partial, and some should not be called a broadening wedge at all.
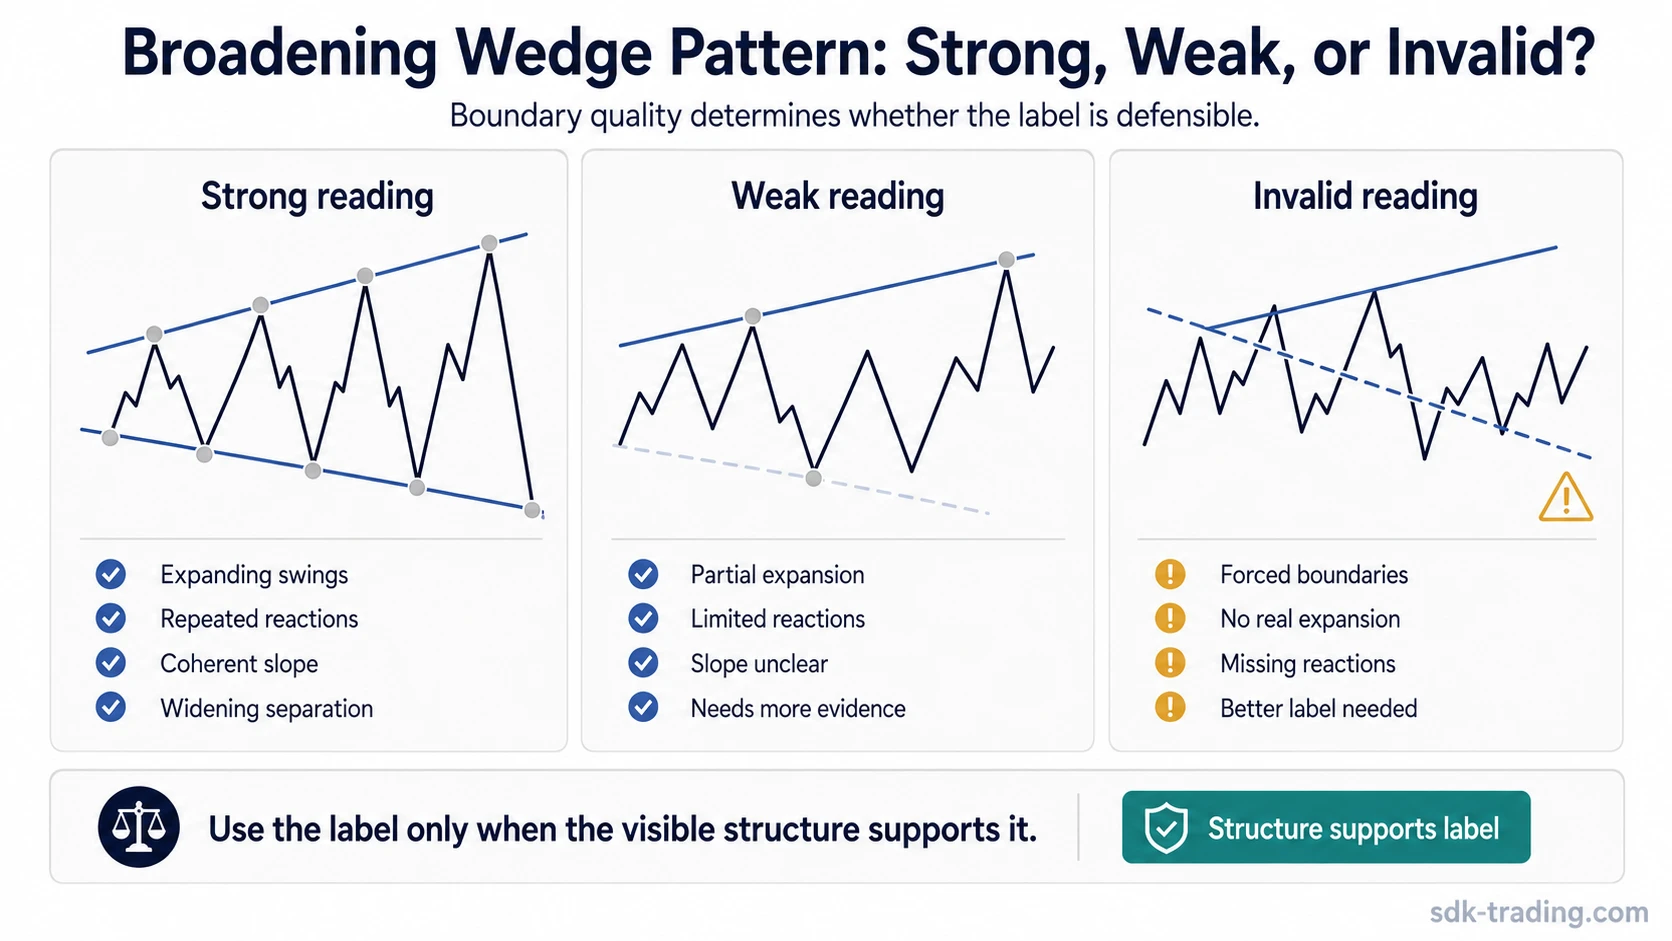
| Reading quality | Visible evidence | Typical problem avoided |
|---|---|---|
| Clean | Expanding swings, two coherent sloping boundaries, repeated reactions on both sides, and clear separation from variants. | Calling every volatile chart a broadening wedge. |
| Weak | Some expansion is visible, but touch count, slope quality, or swing sequence is unclear. | Overstating a structure before the chart has enough boundary evidence. |
| Invalid | Boundaries are forced, swings do not expand, reactions are missing, or another pattern explains the chart better. | Defending a label after the structure no longer supports it. |
A weak broadening wedge can become cleaner if later reactions respect the boundaries and continue the expanding sequence. It can also become invalid if the next swing breaks the boundary logic or compresses into a different structure.
Ascending vs Descending Broadening Wedges
Ascending and descending broadening wedges describe the slope direction of the structure. They are variants of the broader label, not automatic directional forecasts.
| Variant | Basic structure | Clean reading depends on |
|---|---|---|
| Ascending broadening wedge | The structure slopes upward while the range widens. | Higher boundary reactions, expanding swings, and a readable upward bias. |
| Descending broadening wedge | The structure slopes downward while the range widens. | Lower boundary reactions, expanding swings, and a readable downward bias. |
The parent broadening wedge concept is useful because it separates the general expanding-wedge structure from the slope-specific variants. The variant label should come after the boundary and swing sequence are clear.
Broadening Wedge vs Megaphone, Broadening Formation, and Narrowing Wedge
Broadening wedges are easy to confuse with nearby chart structures because all of them can involve volatility, boundary lines, and repeated reactions. The distinction comes from boundary slope, expansion behavior, and context.
| Structure | How it differs from a broadening wedge |
|---|---|
| Broadening formation | A broader family term for expanding structures. A broadening wedge is more specific because the boundaries have a wedge-like directional slope. |
| Megaphone pattern | Often describes a wider expanding formation with diverging highs and lows. A broadening wedge needs clearer slope logic rather than only a megaphone-like outline. |
| Narrowing wedge | The distance between boundaries contracts instead of expands. Compression, not widening separation, defines the narrowing version. |
| Broadening top | Context matters more strongly. A broadening top belongs near upper or topping areas, while a broadening wedge label focuses on the expanding sloped structure itself. |
When two labels seem possible, the stronger label is the one that explains more swing reactions with less line forcing. A pattern name should reduce ambiguity, not add it.
Confirmation and Invalidation in a Broadening Wedge
Confirmation in a broadening wedge is best treated as observation quality. A later boundary reaction, failed retest, or acceptance beyond a boundary can clarify how the structure is behaving, but it does not create a complete trading plan by itself.
| Behavior | What it can clarify | What it cannot prove alone |
|---|---|---|
| Repeated boundary reaction | The boundary is visible enough to matter structurally. | That the next move is predictable. |
| Acceptance beyond a boundary | The old structure may be changing or resolving. | That the break is automatically a signal. |
| Failed retest | The market did not reclaim or respect the prior boundary in the same way. | That a fixed target or outcome follows. |
| Loss of swing expansion | The broadening wedge label may be weakening. | That a new label is valid without fresh evidence. |
Invalidation is structural. If the chart no longer shows widening swings between coherent boundaries, the label loses quality even if the original drawing looked persuasive.
Broadening Wedge Pattern Example in Context
Price advances from a tighter range into a wider sequence of reactions. The first upper reaction is followed by a pullback that travels farther than the prior decline. The next advance reaches beyond the earlier high, but the lower reaction also extends farther than before. Two sloping boundaries begin to describe the widening movement.
At that stage, the chart is still only a candidate structure because two wide reactions can come from volatility alone; the label becomes more defensible only when later reactions make the widening boundary logic visible.
The tempting read is to label the structure immediately after the second wide swing. The stronger read waits for both boundaries to receive enough reactions to show that the widening structure is not just one volatile push and one sharp pullback.
The reading weakens if the next swings stop expanding, if one boundary stops receiving reactions, or if the structure compresses into a narrowing wedge. The next comparison is not direction first; it is whether the visible swing evidence still supports the broadening wedge label.
Common Broadening Wedge Mistakes
| Mistake | Cleaner interpretation |
|---|---|
| Drawing boundaries through unrelated highs and lows | Use only boundaries that explain repeated reactions without ignoring clearer structure. |
| Calling any volatile range a broadening wedge | Look for expansion plus coherent slope, not volatility alone. |
| Treating the pattern as a prediction | Read it as a structure first; confirmation and invalidation are separate observations. |
| Letting a variant take over the parent label | Identify the broadening wedge structure first, then decide whether ascending or descending slope is clear. |
| Keeping the label after evidence changes | Revise the label when swing expansion, boundary reactions, or slope quality no longer support it. |
FAQ
What is a broadening wedge pattern?
A broadening wedge pattern is a chart structure where price swings widen between two sloping boundaries. The structure begins narrower and becomes wider as later swings travel farther from the earlier range.
Is a broadening wedge the same as a megaphone pattern?
No. A megaphone pattern is often used for a broader expanding formation, while a broadening wedge needs clearer wedge-like slope and boundary behavior. The two can overlap visually, but the label should follow the structure that explains the chart more cleanly.
What makes a broadening wedge reading weak?
A broadening wedge reading is weak when the boundaries are noisy, touch count is limited, swings do not expand clearly, or the chart fits a neighboring structure better.
Does a broadening wedge predict price direction?
No. A broadening wedge describes expanding chart structure. Later boundary behavior, acceptance, rejection, and invalidation can clarify the reading, but the pattern alone does not predict price direction.