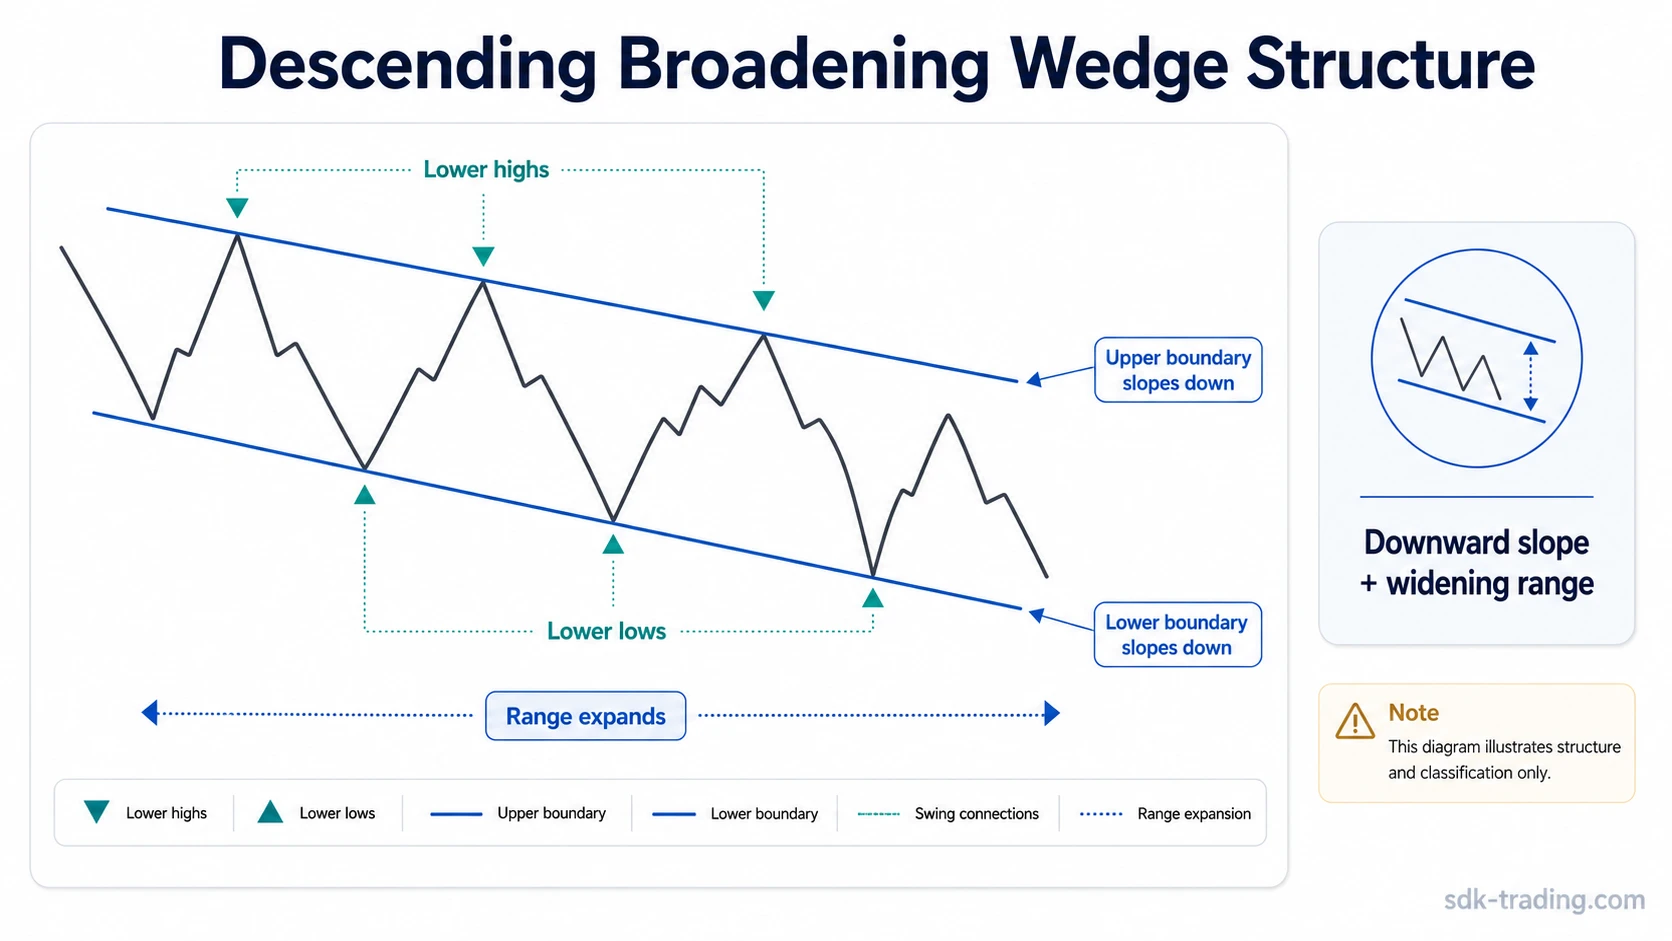
A descending broadening wedge is a chart pattern where price swings widen while both the upper and lower boundaries slope downward. The structure is identified by lower swing highs, lower swing lows, and two downward-sloping boundaries that diverge as the pattern develops.
The pattern belongs to the broader broadening wedge family, but the descending version has a specific requirement: the whole formation must expand while drifting downward. A label alone is not enough. The classification depends on whether the boundaries are visible, repeatable, and structurally testable.
Definition: A descending broadening wedge is an expanding chart structure formed by lower highs and lower lows between two downward-sloping lines that move farther apart from left to right.
Key Points
- The upper boundary slopes downward through lower swing highs.
- The lower boundary also slopes downward through lower swing lows.
- The two boundaries diverge, so the range expands instead of compressing.
- A cleaner classification needs several visible reactions on both sides, not one adjusted line.
- The pattern should be treated as a structural classification, not as a standalone trading signal.
What Is a Descending Broadening Wedge?
A descending broadening wedge is a downward-sloping expanding pattern. Price continues to make lower highs and lower lows, but each swing tends to cover more distance than the previous one. The result is a formation that points downward while range expansion becomes more visible.
The important distinction is divergence. A normal falling wedge narrows as the swings compress. A descending broadening wedge does the opposite: the upper and lower boundaries separate as the pattern develops. If the lines converge, the formation is not a descending broadening wedge.
The pattern can appear during unstable declines, reactive pullbacks, or wider two-sided movement. Its meaning depends on context, but the first task is structural: decide whether the price action actually forms an expanding downward range.
How a Descending Broadening Wedge Forms
The formation begins when price starts producing lower swing highs while also pushing to lower swing lows. The upper side reflects repeated lower high points. The lower side reflects deeper downside excursions. As the swing highs and swing lows keep moving lower while the two boundaries separate, the visible space between the upper and lower sides expands.
A clean formation usually has a readable sequence rather than a single dramatic move. The swings do not need to be perfectly symmetrical, but the chart should show an expanding footprint. If one side is clear while the other requires heavy adjustment, the classification becomes weaker.
| Structural feature | What it means | Reading risk |
|---|---|---|
| Lower swing highs | The upper boundary slopes downward. | If the highs are flat or rising, the pattern may belong to another family. |
| Lower swing lows | The lower boundary also slopes downward. | If lows do not extend downward, the wedge classification becomes doubtful. |
| Diverging boundaries | The range expands from left to right. | If the boundaries converge, it is not a descending broadening wedge. |
| Multiple boundary reactions | Both sides of the formation are observable. | Sparse contacts can turn the label into a forced drawing. |
| Expanding swing distance | Later swings cover more vertical range than earlier swings. | If range does not expand, the broadening condition is missing. |
How to Identify a Descending Broadening Wedge
Identification starts with the boundaries, not with the name. A defensible classification needs a downward-sloping upper line, a downward-sloping lower line, and visible expansion between them. The pattern is cleaner when the swing points can be marked without repeatedly redrawing the lines after every new candle.
Identification Checklist:
- Mark at least two lower swing highs on the upper side.
- Mark at least two lower swing lows on the lower side.
- Check that both boundaries slope downward.
- Confirm that the distance between boundaries expands from left to right.
- Look for several reactions on both sides, not one isolated touch.
- Reject the label if the lines need constant adjustment to remain valid.
A basic label can be tempting when price is moving sharply downward and the outer swings look dramatic. The diagnostic question is narrower: are the highs and lows forming a stable expanding framework, or are lines being forced around random movement? The second case should stay tentative or be rejected.
Diagnostic note: The classification weakens if the boundaries need to be redrawn repeatedly, if one side has too few reactions, or if the formation stops expanding. A pattern name is useful only when the boundary behavior can be observed without forcing it.
Clean, Weak, and Invalid Descending Broadening Wedge Readings
The strongest version is not the one with the most dramatic price movement. It is the one where the visible formation fits the definition without extra interpretation. Clean, weak, and invalid cases should be separated before any later context is considered.
| Reading quality | What the chart shows | How to classify it |
|---|---|---|
| Clean reading | Lower highs, lower lows, downward-sloping diverging boundaries, and several reactions on both sides. | The formation can be classified as a descending broadening wedge. |
| Weak reading | Some expansion is visible, but one boundary has sparse contact or the line placement feels adjusted. | The classification remains tentative and needs clearer boundary evidence. |
| Invalid reading | The lines converge, one boundary is not downward-sloping, or the movement is random rather than expanding. | The descending broadening wedge label should be rejected. |
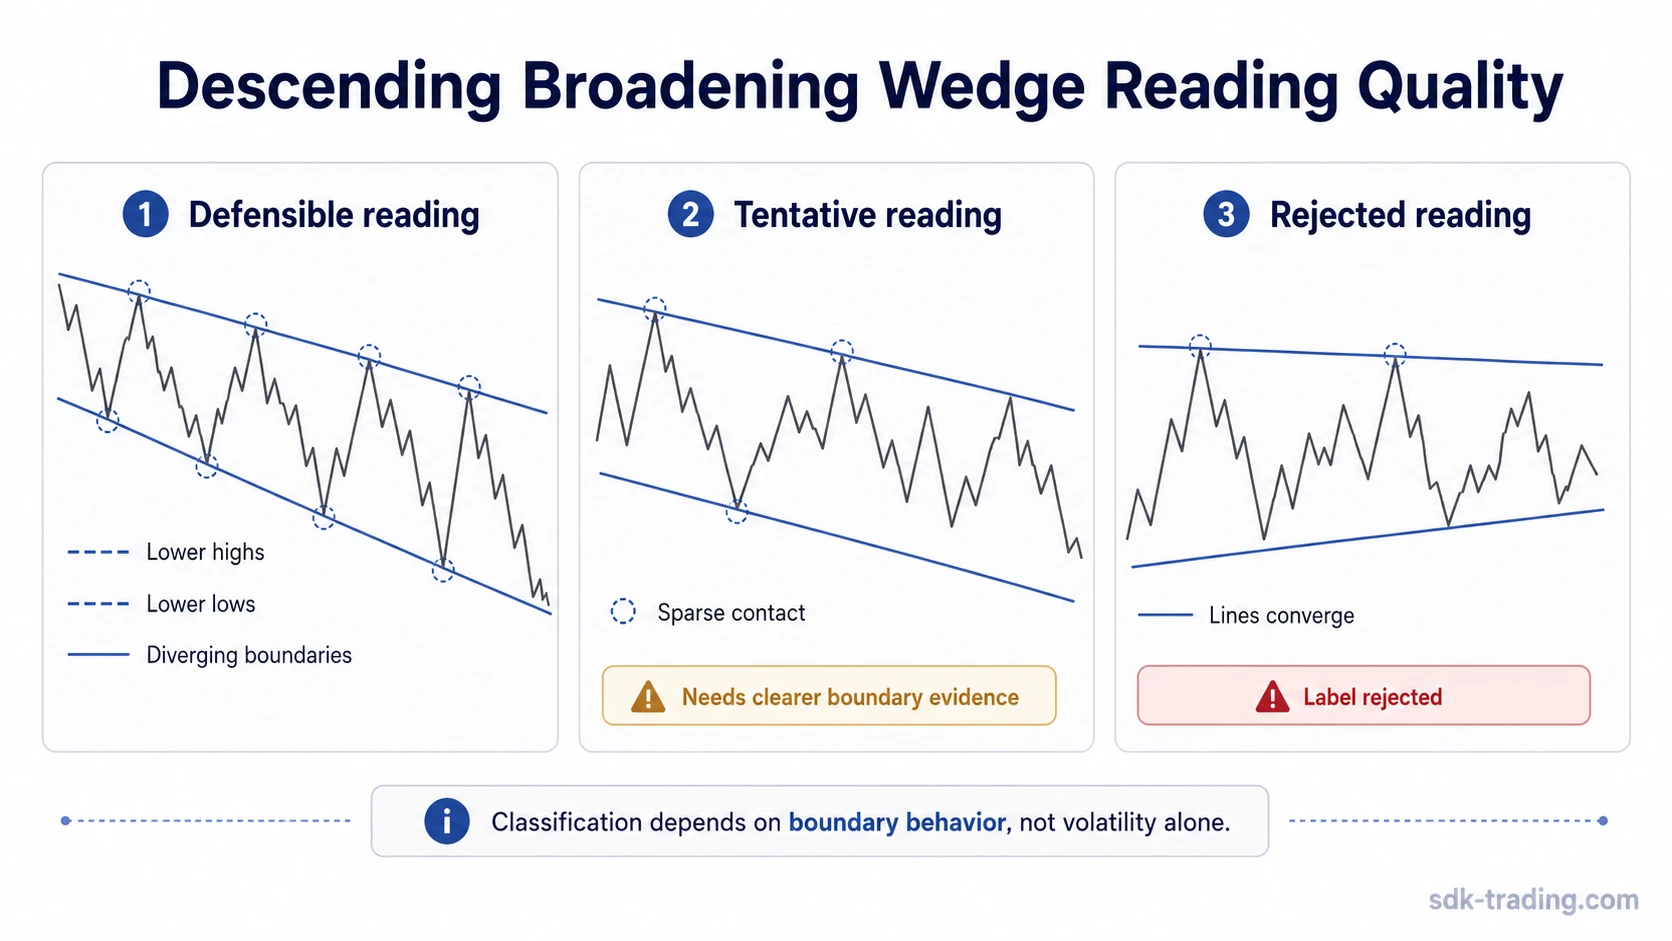
This separation prevents a common error: treating any volatile decline as a descending broadening wedge. The pattern must expand in a specific way. Volatility alone does not create it.
Descending Broadening Wedge vs Related Patterns
Neighbor separation matters because several chart patterns use expanding or wedge-like language. The descending broadening wedge should not absorb every broad formation. Its unique feature is the combination of downward slope and diverging boundaries.
| Related pattern | Main structure | Difference from descending broadening wedge |
|---|---|---|
| Ascending broadening wedge | Expanding wedge with upward-sloping boundaries. | The slope is upward, while a descending broadening wedge slopes downward. |
| Broadening top | Expanding top-like formation with higher highs and lower lows. | The focus is a top-like broadening range, not a downward-sloping wedge. |
| Broadening bottom | Expanding formation associated with a bottoming area. | The classification depends on bottom-like structure rather than descending wedge slope. |
| Broad expanding pattern | Wide expanding swings that often resemble a megaphone shape. | The broad expansion idea is wider than the descending wedge variant. |
The safest comparison is visual: an ascending version expands upward, a broadening top expands around a top-like formation, and a megaphone-style pattern describes wider expanding swings. The descending broadening wedge needs both boundaries to slope downward while the distance between them increases.
Common Mistakes When Reading the Pattern
The most common mistake is drawing the pattern after the fact around a volatile decline. If the boundary contacts are sparse, the wedge can look convincing only because the lines were adjusted to fit the latest swing.
Where the Reading Breaks Down:
- Converging lines: If the boundaries narrow, the broadening condition is missing.
- Flat or rising upper side: If the upper boundary does not slope downward, the structure is not the descending version.
- One-sided contact: If only the lower boundary is visible, the structure is incomplete.
- Random volatility: Wide swings are not enough unless they form a repeatable expanding range.
- Deterministic interpretation: The pattern does not prove a future move by itself.
A realistic chart-reading problem occurs when price makes a sharp lower low after several uneven pullbacks. The move may look like the lower edge of a descending broadening wedge, but the label remains weak if the prior highs do not form a usable downward-sloping upper boundary. The stronger case appears only when both sides can be marked without forcing the lines.
Final Interpretation
A descending broadening wedge is best treated as a structural reading of expanding downward price action. The useful question is not whether the label sounds familiar, but whether the chart shows lower highs, lower lows, two downward-sloping boundaries, and a range that clearly expands from left to right.
When those conditions are visible, the pattern can be classified cleanly. When the formation depends on repeated redrawing, sparse contacts, or volatility without boundary discipline, the reading should remain weak or be rejected.
FAQ
What does a descending broadening wedge mean?
It means price is moving inside a downward-sloping expanding structure. The pattern shows lower highs, lower lows, and diverging boundaries, but its interpretation still depends on structure quality and surrounding context.
How do you identify a descending broadening wedge?
Identify a downward-sloping upper boundary, a downward-sloping lower boundary, and expanding space between them. The reading is cleaner when both sides have several visible reactions.
Is a descending broadening wedge the same as a falling wedge?
No. A falling wedge usually narrows as it develops. A descending broadening wedge widens as both boundaries slope downward.
When is the pattern invalid?
The pattern is invalid when the boundaries converge, when one side does not slope downward, or when the lines are forced around random price movement without a clear expanding structure.