A megaphone pattern is a chart pattern where price swings expand outward over time, forming higher swing highs and lower swing lows between two diverging boundaries. The pattern describes visible structure: widening volatility, repeated boundary reactions, and an expanding swing envelope. It does not create a directional signal by itself.
Key Points
- Core structure: expanding highs and expanding lows.
- Boundary shape: two diverging lines that widen as price moves forward.
- Main evidence: repeated reactions near both boundaries, not one forced line.
- Interpretation: volatility and disagreement are expanding.
- Key limitation: the label is weak if the chart does not show real outward expansion.
What Is a Megaphone Pattern?
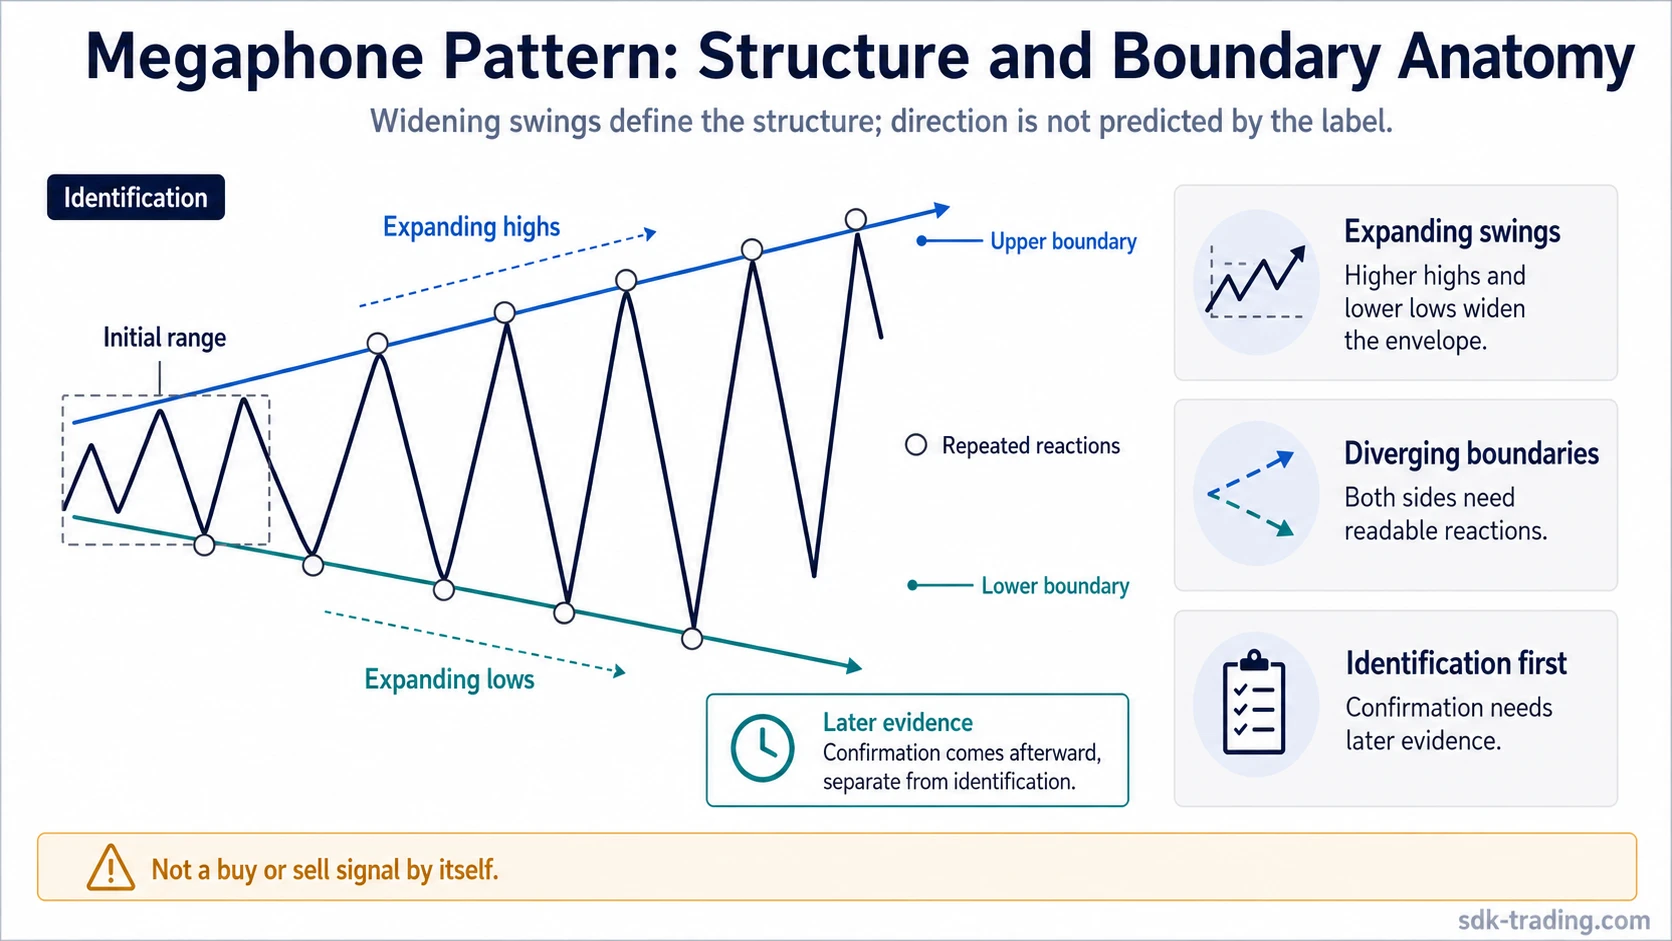
A megaphone pattern appears when price stops moving inside a stable range and begins making wider swings in both directions. Each new reaction tends to extend beyond the previous swing area, creating a shape that looks wider on the right side than on the left.
The upper boundary usually connects a sequence of expanding swing highs. The lower boundary usually connects a sequence of expanding swing lows. A clean reading needs both sides. A chart with only higher highs, only lower lows, or one clean line and one guessed line is not enough.
The pattern is most useful as classification, not prediction. It shows that price discovery is becoming less contained because buyers and sellers are reacting over a wider area.
How a Megaphone Pattern Forms
A megaphone pattern forms when price reactions become progressively larger. Instead of compressing into a narrower range, the market expands away from its earlier midpoint. The swing sequence usually moves from narrower reactions into wider reactions, creating the visible megaphone shape.
Typical Formation Logic:
- Initial range: price begins with a smaller swing area.
- First expansion: a later swing pushes beyond the earlier high or low.
- Opposite-side expansion: price reacts back through the range and extends the other side.
- Boundary reactions: additional swings respect the widening upper and lower areas.
- Widening separation: the distance between the two boundaries increases over time.
That expansion is why the pattern is often associated with volatility growth. It can reflect disagreement, unstable control, or a market still searching for a wider accepted range. Those ideas remain interpretation, not proof of what price must do next.
How to Identify a Megaphone Pattern
Identification starts with the swing sequence. A defensible megaphone reading needs visible expansion on both sides of price, not just a dramatic move or a single broad candle. The pattern becomes clearer when the upper and lower reactions can be connected without forcing the lines through unrelated points.
Megaphone Pattern Identification Checklist:
- Expanding highs: later swing highs reach beyond earlier swing highs.
- Expanding lows: later swing lows reach beyond earlier swing lows.
- Diverging boundaries: the upper and lower boundary lines move farther apart.
- Repeated reactions: price reacts near both sides more than once.
- Readable spacing: the structure widens over time rather than staying flat or random.
- No forced fit: the lines should describe the swings, not rescue a weak label.
Some traders look for five visible swings because that can create enough touch points to judge the structure. The number is best treated as evidence quality, not a rigid rule. A cleaner interpretation comes from the relationship between swings, boundaries, and increasing separation.
Megaphone Pattern Classification Test
A more defensible way to classify a megaphone pattern is to test what the chart actually shows. The label becomes stronger when swing expansion, boundary quality, and reaction count all point to the same structure. It becomes weaker when only one of those elements is present.
| Test question | Clean evidence | Weak evidence | Invalid evidence |
|---|---|---|---|
| What qualifies? | Higher swing highs and lower swing lows form a widening envelope. | Only part of the swing sequence expands. | Price stays inside a fixed range or moves in one-sided trend behavior. |
| Are both boundaries readable? | Both upper and lower boundaries connect repeated reactions. | One boundary is clear, while the other is uneven or guessed. | Lines are forced through unrelated highs or lows. |
| Is separation increasing? | The distance between the boundaries widens over time. | Widening appears briefly but does not persist. | The structure compresses, stays parallel, or fails to expand outward. |
| Does later price action support the label? | Later swings continue reacting inside or around the widening envelope. | Later swings become messy and reduce boundary clarity. | The chart fits another structure better than a megaphone pattern. |
| What weakens the reading? | Only minor imperfections appear, while expansion remains visible. | Touch quality, swing spacing, or the second boundary is unclear. | The pattern depends on ignoring contradictory swing behavior. |
Clean, Weak, and Invalid Megaphone Pattern Readings
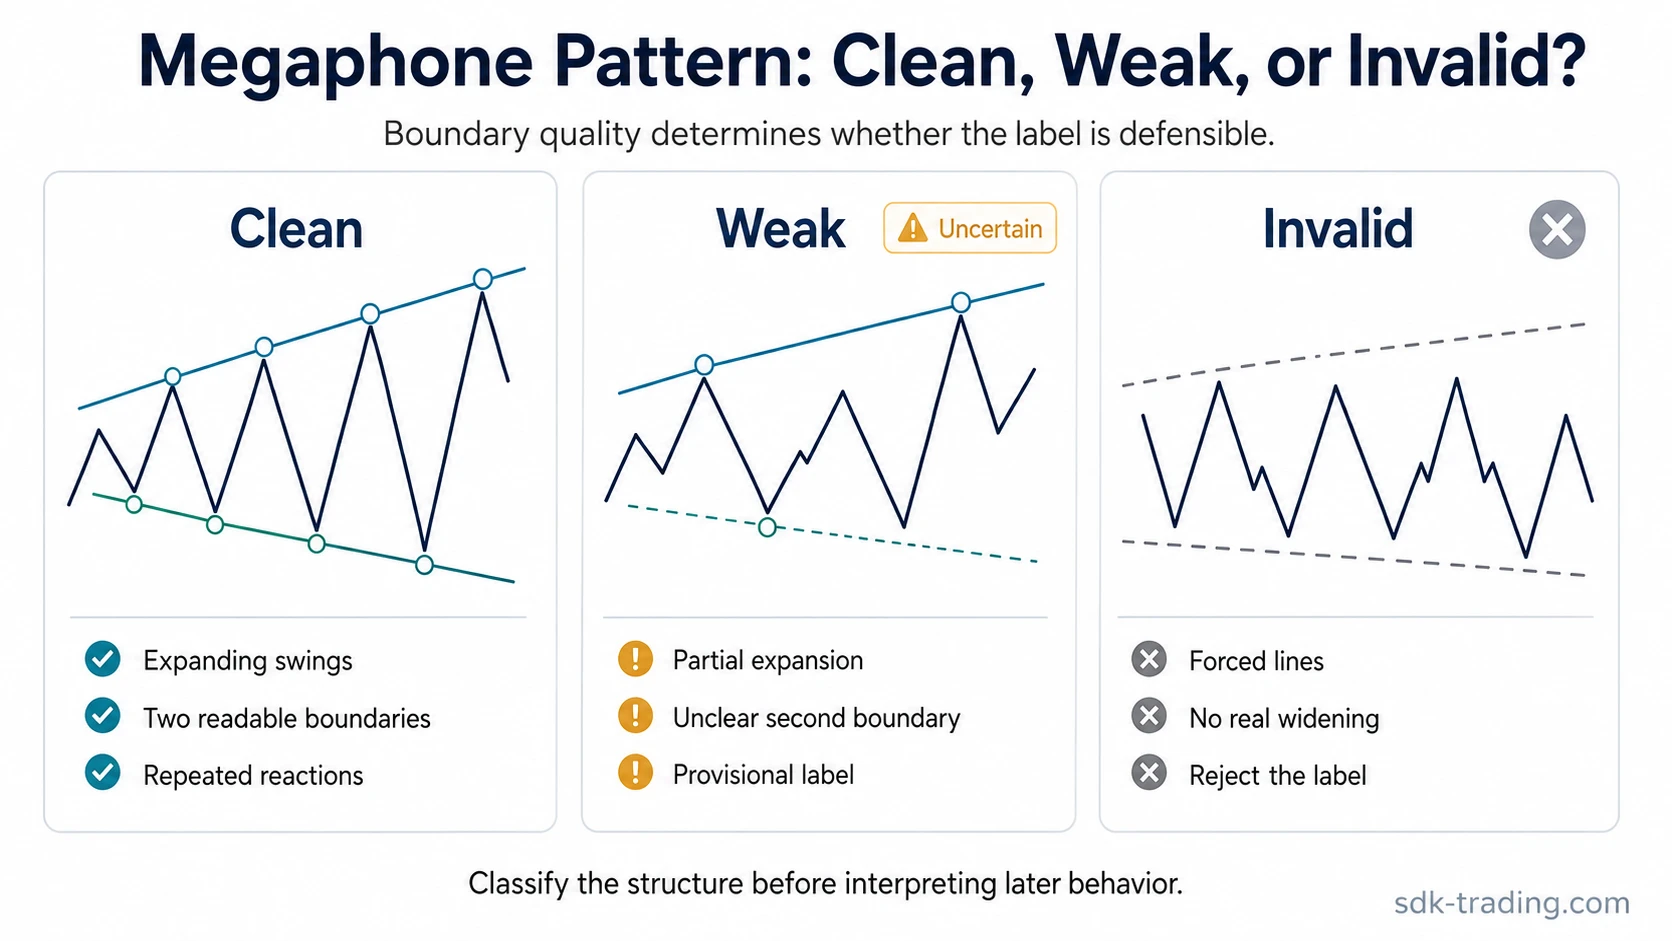
A clean megaphone pattern is easy to describe without overexplaining the lines. The chart shows expanding highs, expanding lows, two coherent boundaries, and repeated reactions on both sides. The wider shape is visible before any later break or failure is interpreted.
A weak megaphone pattern has some evidence but not enough structural agreement. For example, price may create a higher high and a lower low, but the second boundary may be unclear, the reaction count may be thin, or the swings may not expand in a stable sequence.
An invalid megaphone pattern is usually a forced label. The most common failure is drawing wide lines around unrelated volatility and calling the result a pattern. If the chart is a fixed range, a simple trend, a parallel channel, or a structure that fits another pattern better, the megaphone label should not be used.
| Reading quality | What the chart shows | How to treat the label |
|---|---|---|
| Clean | Expanding highs and lows, coherent boundaries, repeated reactions, widening separation. | The structure label is defensible. |
| Weak | Partial expansion, uneven touch quality, unclear second boundary, or one-sided evidence. | The label remains provisional. |
| Invalid | Forced lines, no outward expansion, fixed range behavior, or a better-fitting neighboring structure. | The label should be rejected. |
What a Megaphone Pattern Is Not
A megaphone pattern is not just any volatile chart. Volatility alone can create large candles, sharp reversals, or wide noise without forming a coherent widening structure. The pattern needs a visible relationship between swing highs, swing lows, and boundaries.
It is also not a stand-alone bullish or bearish signal. A megaphone pattern can appear in different market contexts, and the label only describes the expanding structure. Directional interpretation requires separate evidence, such as where the structure appears, whether price accepts or rejects boundary areas, and whether later behavior confirms or contradicts the reading.
A single break beyond a boundary is not enough to settle the interpretation. A break can show possible acceptance outside the structure, or it can fail and move back into the widening envelope. The difference depends on later behavior, not on the label alone.
Megaphone Pattern vs Broadening Top and Broadening Wedge
A broadening top is usually a top-context version of a broadening structure. The overlap is real because both can show expanding highs and lows, but broadening top wording adds context about where the structure appears. A megaphone pattern can be described by its visible widening shape before adding that contextual label.
A broadening wedge belongs to the same broadening family, but the boundary relationship matters. A megaphone reading focuses on an expanding swing envelope, while wedge labels often depend more on the slope relationship between the two boundary lines.
An ascending broadening wedge is more specific because both the broadening behavior and the upward boundary slope matter. That makes it narrower than the general megaphone pattern label.
A broadening bottom adds bottoming context to the broadening structure. The distinction is useful when the same expanding swing logic appears after a lower-range or bottoming phase instead of near an upper-range or top-context area.
Practical Example of a Megaphone Pattern Reading
Consider a chart that first moves inside a narrow range, then pushes to a higher high, reverses to a lower low, and later reacts again near a wider upper boundary. The structure becomes more defensible if the next lower reaction also respects a widening lower boundary. The pattern reading remains weak if only the upper side is clear and the lower side has to be guessed.
The practical mistake is naming the pattern too early. A dramatic high, a sharp low, or one wide reversal can be part of a megaphone pattern, but none of them is enough alone. The label becomes more useful only when the full swing envelope can be seen.
Why Megaphone Patterns Can Fail
A megaphone pattern can fail as a reading when the chart stops respecting the widening structure. Failure does not need to mean a dramatic move. It can simply mean that later price action no longer supports the boundaries, the swing sequence loses outward expansion, or another structure explains the chart more cleanly.
Common Failure Conditions:
- Boundary failure: later reactions no longer respect the widening lines.
- Expansion failure: new swings stop expanding beyond earlier highs and lows.
- Touch-count failure: too few reactions exist to justify both boundaries.
- Structure conflict: a range, channel, wedge, or trend explains the chart better.
- Forced-line failure: the pattern depends on ignoring important swing points.
Failed breaks are especially important to describe carefully. A move beyond a boundary may look important at first, but the reading changes if price quickly returns inside the structure and later swings do not confirm acceptance outside it. That behavior can weaken the boundary reading or show that the original structure was incomplete.
FAQ
Is a megaphone pattern bullish or bearish?
A megaphone pattern is not automatically bullish or bearish. It describes expanding price swings between diverging boundaries. Directional interpretation depends on context and later price behavior.
Is a megaphone pattern the same as a broadening top?
Not exactly. A broadening top adds top-context meaning, while a megaphone pattern describes the visible widening structure. The same chart may be discussed with both terms when the structure appears near an upper-range area.
How many swings does a megaphone pattern need?
There is no single fixed number that makes every reading valid. Five visible swings can provide useful evidence, but boundary quality, expanding highs and lows, and repeated reactions matter more than a mechanical count.
Can a megaphone pattern fail?
Yes. The reading can fail if price no longer respects the widening structure, if swing expansion disappears, or if another chart structure explains the movement more cleanly.