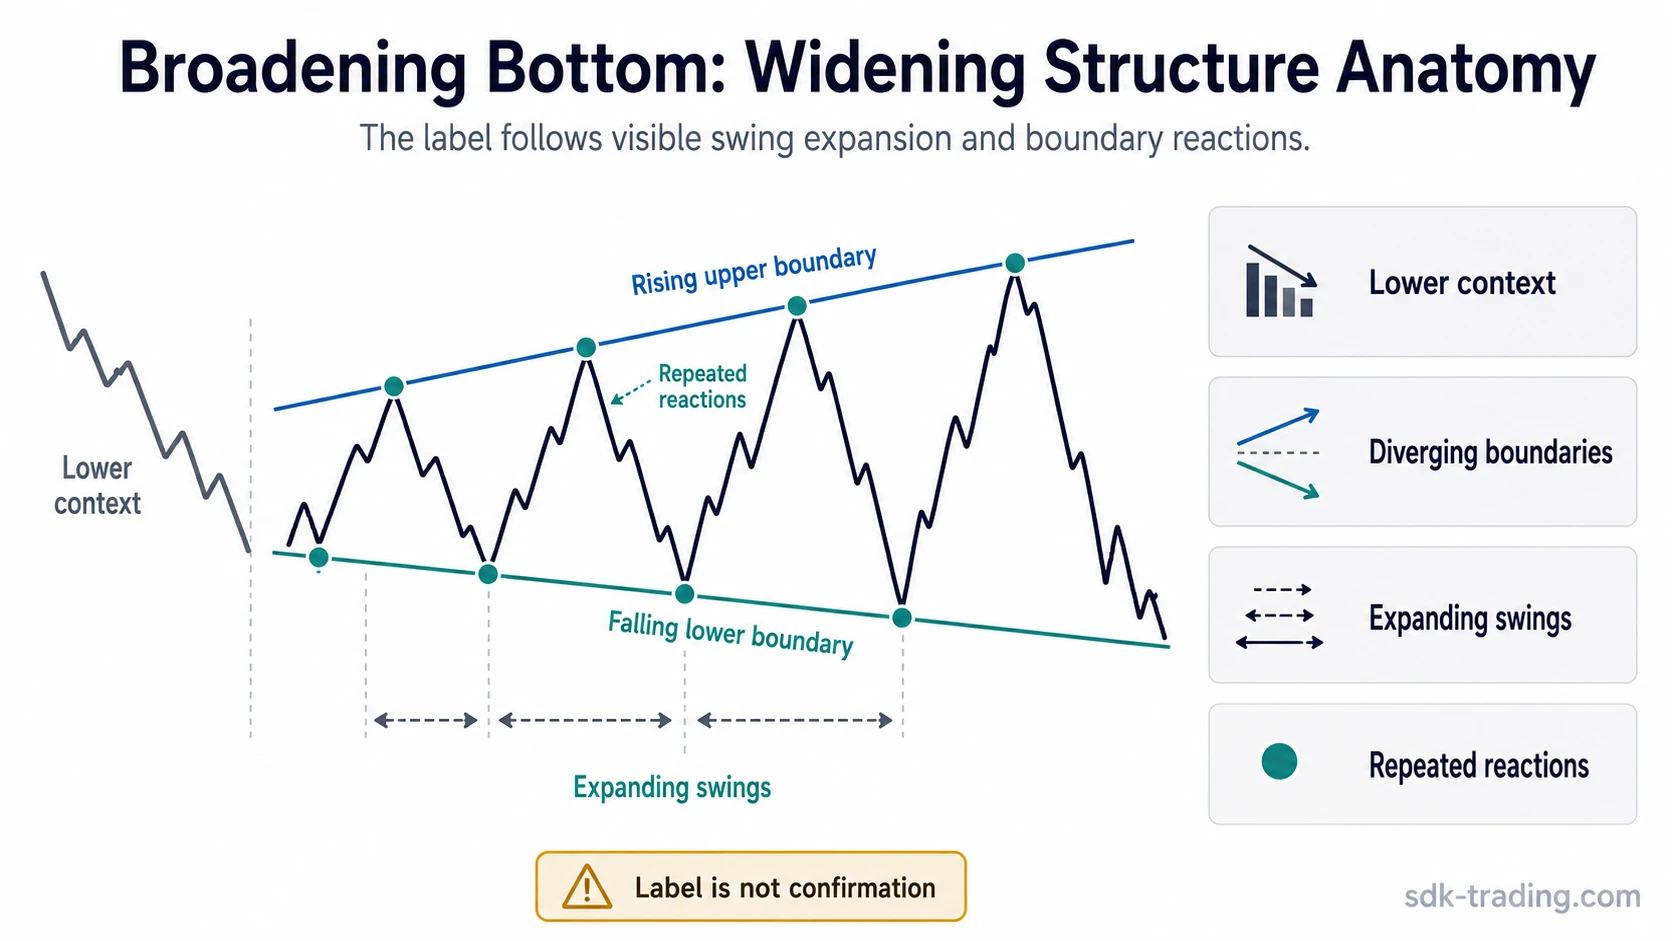
A broadening bottom is a chart pattern structure where price swings widen after a downward or bottoming phase, forming an upward-sloping upper boundary and a downward-sloping lower boundary. The label depends on visible swing expansion and repeated boundary reactions, not on the pattern name alone.
A broadening bottom belongs to the broader family of broadening chart patterns, where volatility or participation expands instead of narrowing into a compact range. Within that family, the broadening bottom describes a widening structure that appears in a lower or bottoming area of a chart.
Identification and confirmation are separate. Identification describes the visible structure: expanding swing highs, expanding swing lows, and diverging boundaries. Confirmation describes later price behavior after the structure has already been identified. A broadening bottom is therefore not a prediction, not a standalone trading signal, and not automatically bullish by label alone.
Key Points About a Broadening Bottom
- A broadening bottom forms through widening price swings in a downward or bottoming context.
- The upper boundary usually slopes upward while the lower boundary slopes downward.
- Repeated reactions near both boundaries make the classification stronger.
- The pattern becomes weak when boundaries are forced, touch points are too few, or swing behavior is unclear.
- Confirmation comes after identification and should not be treated as a forecast.
What Is a Broadening Bottom?
A broadening bottom is a widening chart structure that develops when successive swings create a broader price range near a lower area of the chart. Instead of compressing into a triangle or tight consolidation, the structure expands: later rallies can reach higher swing highs while later declines can reach lower swing lows.
The shape is often associated with an unsettled bottoming environment because price is moving farther in both directions. That does not mean the structure guarantees a reversal. It only means the visible chart structure has widened in a way that can be classified as a broadening bottom when the required boundary and swing conditions are present.
| Classification layer | What it means | Broadening bottom application |
|---|---|---|
| Pattern family | Broadening chart patterns | The range expands instead of contracting. |
| Subtype | Broadening bottom | The widening structure appears after or within a downward or bottoming phase. |
| Visible structure | Diverging boundaries | The upper boundary slopes upward and the lower boundary slopes downward. |
| Identification basis | Swing and boundary behavior | Higher swing highs, lower swing lows, and repeated reactions support the label. |
| Limitation | Label is not confirmation | The structure must not be treated as a prediction by itself. |
How to Identify a Broadening Bottom
A broadening bottom starts with visible structure. The chart should first show a downward or bottoming context, then expanding swings that can be connected with two diverging boundaries. The upper boundary should connect rising reaction highs, while the lower boundary should connect falling reaction lows.
The strongest identification comes from interaction with both sides of the structure. A single dramatic low or one sharp rally is not enough. The pattern label becomes more defensible when price moves side to side across the widening range and reacts near both the upper and lower boundaries more than once.
Broadening Bottom Identification Checklist:
- Prior context: price appears after a downward move, lower range, or bottoming attempt.
- Upper boundary: reaction highs can be connected with an upward-sloping line.
- Lower boundary: reaction lows can be connected with a downward-sloping line.
- Expanding swings: the distance between swings increases instead of compressing.
- Boundary reactions: price interacts with both sides of the structure, not only one side.
- Readable movement: the structure is visible without forcing lines through unrelated price action.
- Separate confirmation: later behavior is evaluated after the structure is identified.
Touch count should be treated as evidence quality, not as a mechanical rule. More boundary reactions can make the structure easier to read, but only if the touches reflect real swing behavior. Several messy contacts on one side of the chart do not compensate for the absence of interaction with the other side.
Boundary and Touch Logic
The boundaries matter because they define the widening range. In a broadening bottom, the upper line is not simply a resistance label and the lower line is not simply a support label. Together, they describe an expanding structure where price is testing wider extremes on both sides.
A useful boundary should connect meaningful swing points. If the line only works after ignoring obvious reactions, cutting through major price areas, or selecting isolated candles, the reading is weaker. The same issue appears when the chart has one extreme low but no clear expanding sequence around it.
| Boundary feature | Stronger reading | Weaker reading |
|---|---|---|
| Upper boundary | Connects multiple rising reaction highs. | Depends on one isolated high or a forced line. |
| Lower boundary | Connects multiple falling reaction lows. | Uses one dramatic low without a broader sequence. |
| Swing expansion | Later swings become visibly wider. | The range stays flat, compressed, or random. |
| Side-to-side movement | Price travels across the widening range. | Price reacts mainly on one side only. |
| Line quality | Boundaries describe the structure without cutting through the main swing logic. | The label works only after ignoring contradictory price action. |
Clean, Weak, and Invalid Broadening Bottom Structures
The broadening bottom label is strongest when the structure can be seen before the name is applied. A clean structure does not need the chart to be perfect, but it should show enough repeated boundary behavior to make the classification defensible.
A weak structure is different from an invalid one. Weak structures may contain some widening behavior, but the boundaries, swing sequence, or context remain uncertain. Invalid structures fail the basic classification test because the chart does not show a readable broadening bottom.
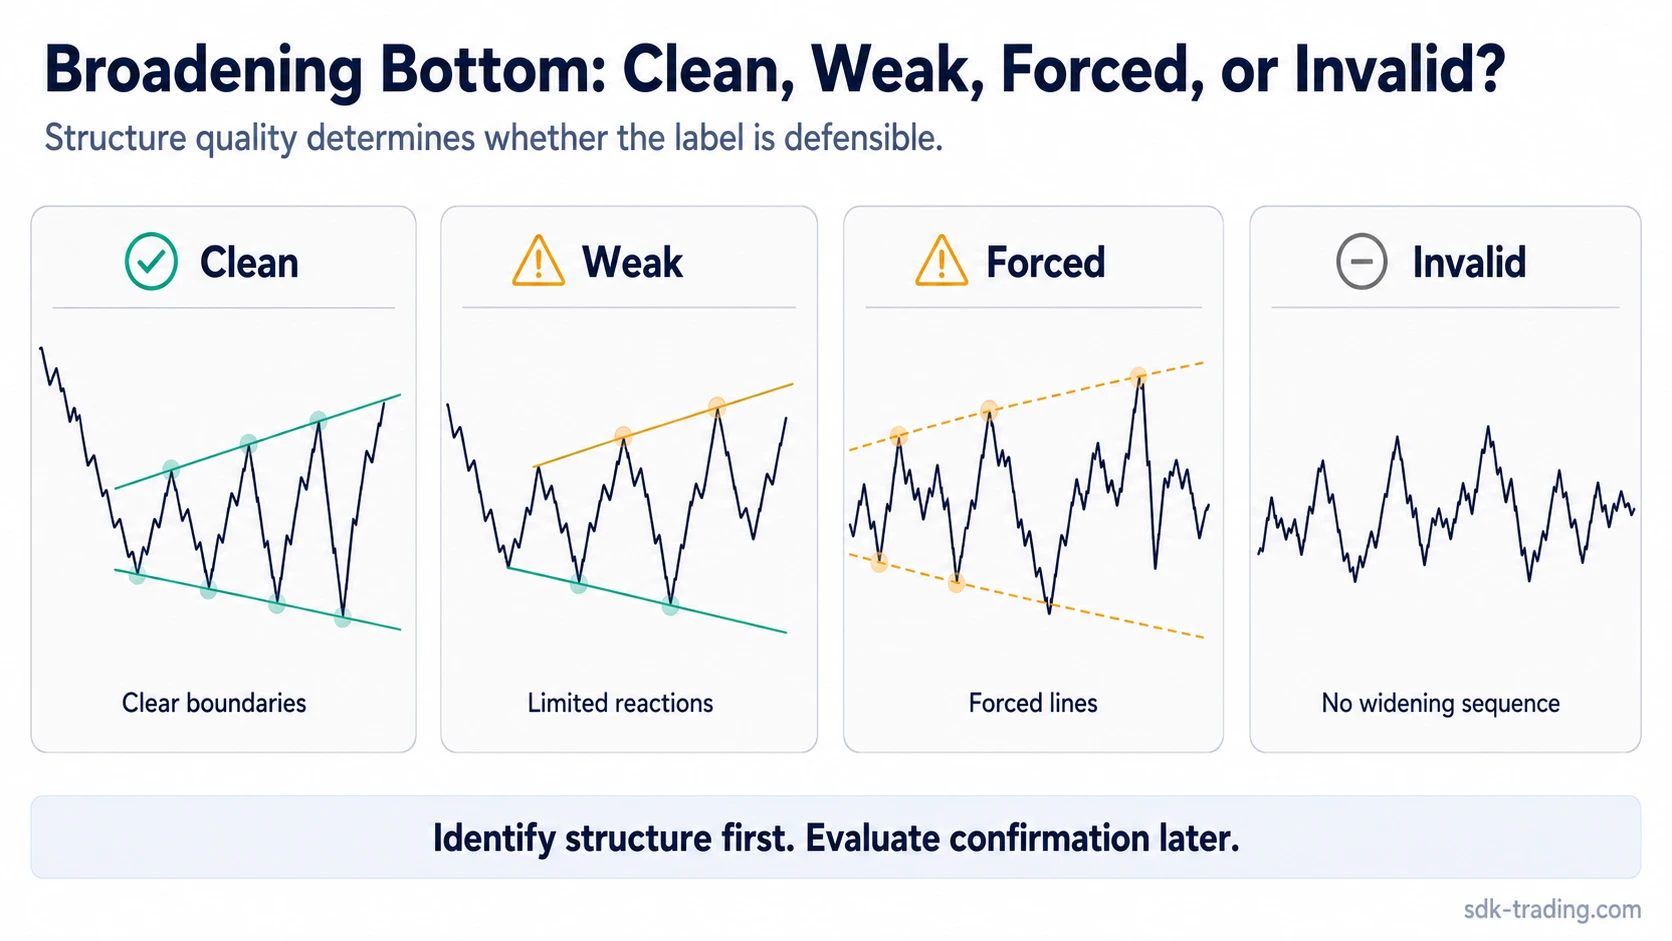
| Diagnostic category | What it looks like | How to treat the label |
|---|---|---|
| Clean broadening bottom | Downward or bottoming context, rising upper boundary, falling lower boundary, expanding swings, and repeated reactions near both sides. | The label is structurally defensible, while confirmation remains separate. |
| Weak broadening bottom | Some expansion appears, but touch points are limited, one boundary is unclear, or swings do not travel cleanly across the structure. | The label may be provisional and should not carry strong interpretation. |
| Forced broadening bottom | Lines are drawn through unrelated price action or selected after the fact to make the shape fit. | The label is unreliable because the visible structure does not support it. |
| Invalid broadening bottom | No widening sequence, no diverging boundaries, no repeated boundary reactions, or a context that belongs to a different pattern family. | The label should be rejected or replaced with a more accurate structural description. |
Broadening Bottom Confirmation vs Identification
Identification answers one question: does the visible chart structure qualify as a broadening bottom? Confirmation answers a different question: what later behavior makes the structure more meaningful or less meaningful? These two ideas should not be blended.
A chart can be identifiable before it is confirmed. It can also remain identifiable while later behavior fails to support a stronger interpretation. That distinction matters because the pattern name alone does not create a forecast, trade setup, or directional conclusion.
| Step | Question | What belongs here |
|---|---|---|
| Identification | Is the structure a broadening bottom? | Context, diverging boundaries, expanding swings, and boundary reactions. |
| Confirmation | Does later behavior support the interpretation? | Subsequent price behavior after the structure is already visible. |
| Invalidation | Does the structure fail to behave like the label suggests? | Contradictory swing behavior, broken boundary logic, or a better-fitting pattern family. |
What a Broadening Bottom Can and Cannot Suggest
A broadening bottom can suggest that price movement has become less compressed near a lower area of the chart. The widening range may reflect disagreement, unstable participation, or repeated attempts to test wider extremes on both sides.
That interpretation has limits. A broadening bottom does not prove that a reversal has started, does not define an entry, does not provide a stop-loss level, and does not produce a price target by itself. The structure is a classification tool first.
Structure-first rule: the pattern name should describe the visible chart structure. It should not be used to force a directional story onto unclear price action.
Broadening Bottom vs Related Broadening Patterns
Broadening patterns can look similar because several of them use expanding highs, expanding lows, or diverging boundaries. The difference comes from context, boundary slope, and the specific subtype being classified.
| Related concept | Main distinction | Relationship to broadening bottom |
|---|---|---|
| Megaphone pattern | A broader shape label for expanding highs and lows. | A broadening bottom can resemble a megaphone-style expansion, but the bottoming context matters. |
| Broadening top | A widening structure associated with an upper or topping context. | The broadening bottom uses similar expansion logic but appears in a lower or bottoming area. |
| Broadening wedge | A wedge-family structure with diverging boundaries. | The broadening bottom should not be treated as a generic wedge unless the wedge-specific boundary logic fits. |
| Ascending broadening wedge | A broadening wedge subtype with an upward structural bias in its boundary arrangement. | It may share widening behavior, but the subtype classification depends on the slope and context of both boundaries. |
| Descending broadening wedge | A descending wedge-family subtype with widening behavior. | It should be separated from a broadening bottom unless the full wedge structure supports that label. |
The safest classification process starts with the visible structure. First identify the context, then boundary direction, then swing expansion, then repeated reactions. The pattern family name should come after those observations.
Common Mistakes When Reading a Broadening Bottom
A common mistake is treating the word “bottom” as a directional conclusion. In chart-pattern classification, bottom describes the location and context of the widening structure. It does not prove that price has completed a bottom or that later movement must resolve upward.
| Mistake | Why it weakens the reading | Cleaner interpretation |
|---|---|---|
| Calling one sharp low a broadening bottom | One low does not create an expanding structure by itself. | Look for repeated swings and boundary reactions. |
| Drawing boundaries after choosing the label | The chart can be made to fit almost any label if lines are forced. | Let swing points define the structure first. |
| Treating the label as confirmation | Identification and later confirmation are different steps. | Separate visible structure from subsequent price behavior. |
| Ignoring failed boundary reactions | Contradictory behavior can weaken the classification. | Reassess whether another pattern family describes the chart better. |
| Confusing every expansion with a broadening bottom | Some widening structures belong to wedge, top, or general megaphone families. | Use context and boundary slope before naming the subtype. |
If the chart is better described as a broadening wedge, a broadening top, or a general megaphone-style expansion, forcing the broadening bottom label can make the analysis less precise.
Structure-first rule: a broadening bottom is more defensible when the pattern name describes what the chart already shows. It is less defensible when the name is chosen first and the boundaries are adjusted afterward.
FAQ
Is a broadening bottom always bullish?
No. A broadening bottom describes a widening chart structure in a lower or bottoming context. It is not automatically bullish, and the label alone does not confirm future direction.
How many touches does a broadening bottom need?
There is no safe mechanical touch count. The structure becomes more credible when meaningful swing points react near both the upper and lower boundaries, rather than relying on one isolated high or low.
What makes a broadening bottom pattern weak?
A broadening bottom pattern becomes weak when boundaries are forced, touch points are too few, swing expansion is unclear, or price does not interact with both sides of the widening structure.
How is a broadening bottom different from a broadening top?
A broadening bottom appears in a lower or bottoming context, while a broadening top appears in an upper or topping context. Both can use expanding swing logic, but the location and interpretation are different.