A bear flag pattern is a bearish continuation chart pattern that forms when a sharp downward move is followed by a contained corrective flag or channel. Identification starts with the visible structure; confirmation depends on later behavior around the flag boundary.
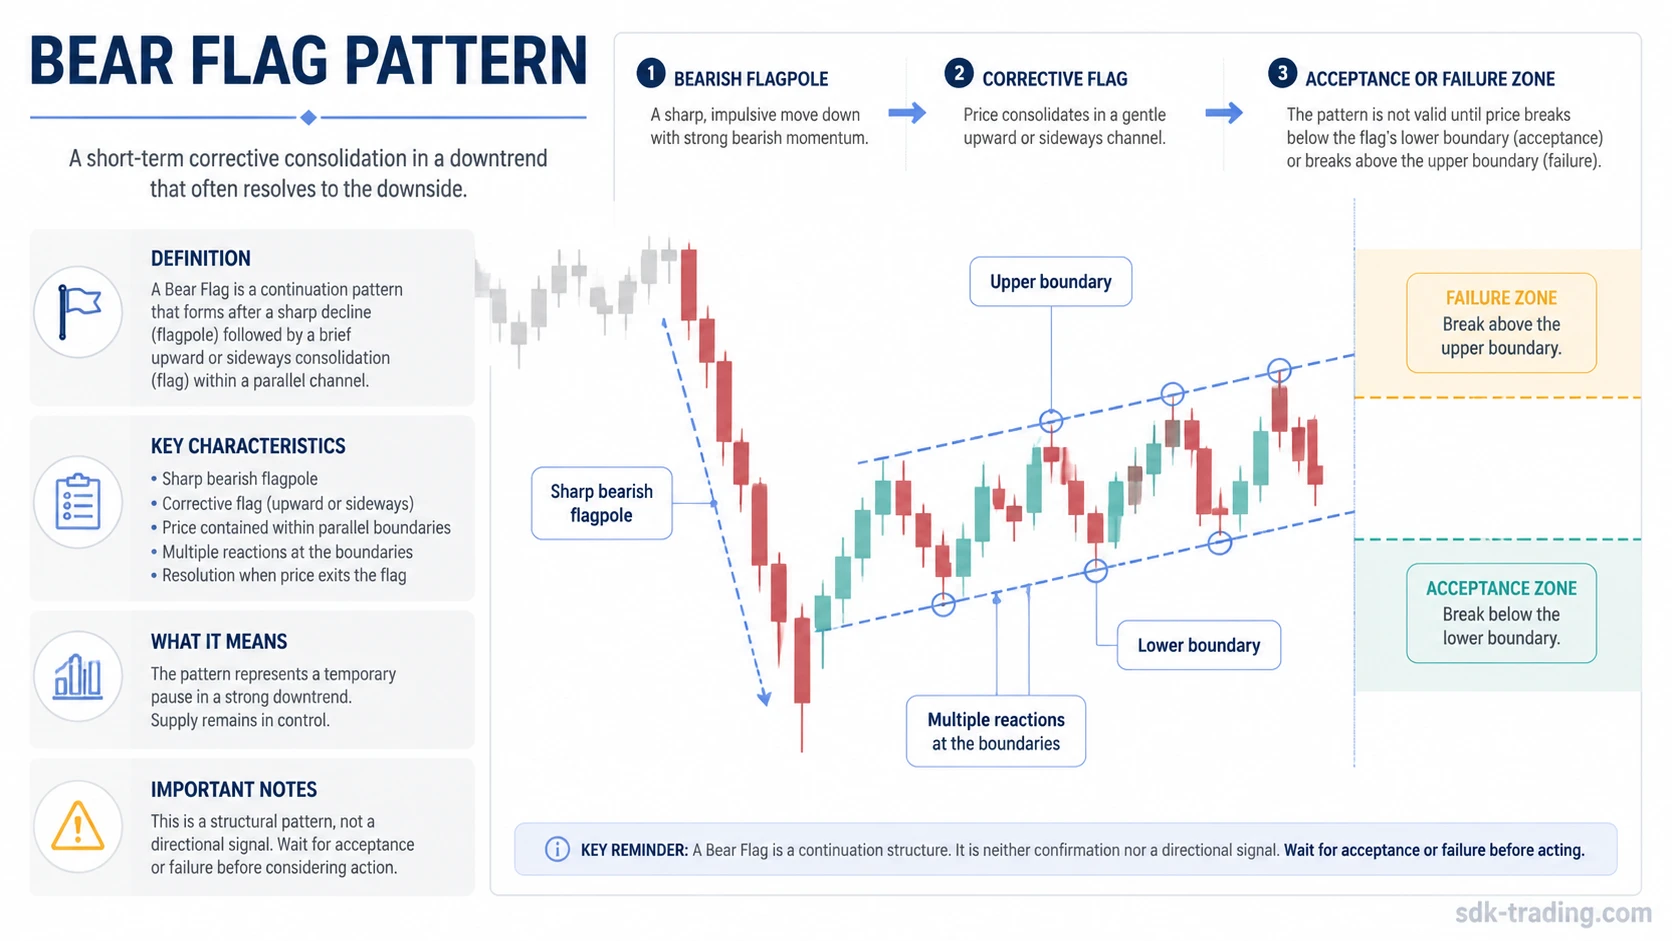
Definition: A bear flag pattern is a trading pattern where price first sells off sharply, then consolidates in a smaller upward or sideways channel before the bearish continuation reading becomes testable. The consolidation is the flag; the preceding decline is the flagpole.
The pattern is not a standalone signal. A clean interpretation depends on context, boundary quality, and whether later price behavior still respects the corrective structure. If the pause expands too widely, breaks above the corrective area, or loses its relationship to the original bearish impulse, the flag interpretation becomes less defensible.
Key Points
- A bear flag needs a visible bearish impulse followed by a smaller corrective structure.
- The flag usually slopes upward or moves sideways while staying contained between two roughly parallel boundaries.
- Boundary quality matters more than simply seeing a pause after a decline.
- A weak or forced interpretation appears when the flagpole is unclear, the channel is messy, or price accepts above the flag.
- The pattern describes structure, not a guaranteed continuation outcome.
What Is a Bear Flag Pattern?
A bear flag pattern appears after a strong bearish move when price pauses in a smaller corrective structure. The pause may look like a narrow upward channel, a sideways drift, or a shallow countertrend consolidation. The key is that the correction remains smaller and more contained than the prior selloff.
The bearish interpretation comes from sequence, not from the word “flag” alone. First, sellers create a clear impulse. Then price pauses without fully undoing that impulse. Only after that structure is visible can the bear flag interpretation be evaluated.
The broader flag pattern family includes both bullish and bearish versions, but the bear flag is the bearish-side structure. It focuses on how a market behaves after a downward impulse rather than after an upward one.
Bear Flag Components
A bear flag interpretation becomes clearer when each component has a visible job. The structure should not be reduced to “price fell, then bounced.” The flagpole, correction, boundaries, and later acceptance or rejection all affect the quality of the pattern label.
| Component | What to Look For | Why It Matters |
|---|---|---|
| Bearish flagpole | A sharp prior decline with clear downside momentum. | Creates the impulse that makes a continuation reading possible. |
| Corrective flag | A smaller upward or sideways consolidation after the decline. | Shows a pause rather than a full recovery against the prior move. |
| Upper and lower boundaries | Two roughly parallel lines containing the correction. | Separates a structured flag from a random bounce or choppy pullback. |
| Reaction count | Multiple reactions near both sides of the flag. | Improves confidence that the boundaries are observed, not forced. |
| Acceptance or failure | Later behavior around the flag boundary. | Helps distinguish a continuing bearish structure from a failed pattern interpretation. |
Volume can add context, but it should not carry the entire interpretation. A low-volume correction after a strong decline may support the bear flag interpretation, while aggressive buying through the corrective structure can weaken it. Volume is a secondary layer, not a replacement for structure.
How to Identify a Bear Flag
Identification starts with the prior move. Without a meaningful bearish impulse, the later consolidation has no flagpole to relate to. A small pause inside ordinary noise is not enough.
- Start with the flagpole: look for a clear selloff before the consolidation.
- Check the correction: the flag should remain smaller than the prior impulse.
- Draw boundaries only where repeated reactions justify them.
- Prefer roughly parallel boundaries over lines that need constant adjustment.
- Watch whether price accepts above the corrective area or rejects it.
- Treat the pattern as incomplete when the channel becomes too wide or directionless.
Identification note: A common false positive is calling any pause after a decline a bear flag before the flagpole and corrective channel are both visible.
Clean, Weak, and Invalid Bear Flag Readings
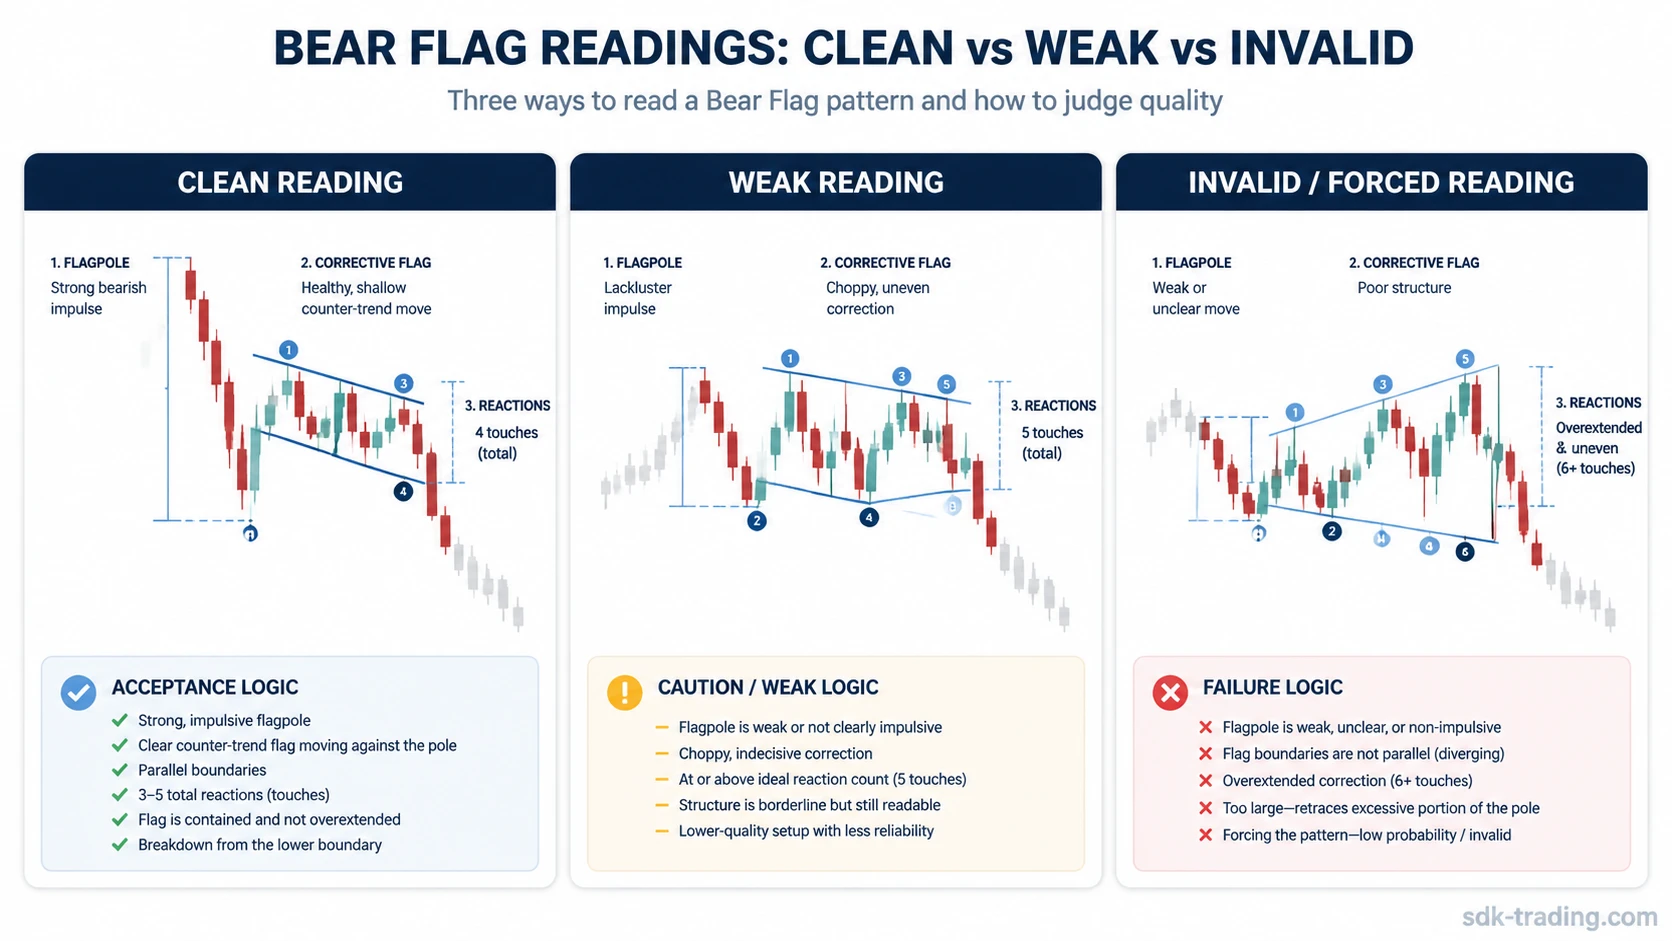
The quality of a bear flag depends on how naturally the structure forms. Clean readings have a strong impulse, a contained correction, and boundaries that can be seen without overfitting. Weak readings have partial evidence. Invalid readings usually rely on lines drawn after the fact.
| Reading Type | Typical Structure | Diagnostic Caution |
|---|---|---|
| Clean reading | Sharp bearish flagpole, narrow corrective flag, repeated reactions near roughly parallel boundaries. | The pattern is visible before later confirmation is judged. |
| Weak reading | Flagpole is present, but the correction is choppy, reaction count is thin, or one boundary is unclear. | The label may still be plausible, but the evidence is not strong enough to treat the structure as clean. |
| Invalid or forced reading | Lines are non-parallel, the correction becomes too wide, or price accepts above the corrective area. | The chart may belong to a different pattern, a broader range, or an ordinary recovery attempt. |
A bear flag loses diagnostic value when the correction becomes too large relative to the flagpole, the boundaries lose coherence, or price spends enough time above the flag to change the structure. The label should follow the chart evidence rather than be imposed on it.
Bear Flag vs Bull Flag, Pennant, and Wedge
A bear flag and a bull flag share the same basic family structure, but their impulse direction is different. A bear flag follows a bearish impulse, while a bull flag follows a bullish impulse.
| Pattern | Boundary Shape | Main Distinction |
|---|---|---|
| Bear flag | Small channel with roughly parallel boundaries. | Forms after a bearish impulse and reflects a contained corrective pause. |
| Pennant | Compact structure with converging boundaries. | Compression is more central than channel-like correction. |
| Wedge | Sloping structure that may broaden beyond a compact flag. | Boundary behavior is broader and should not be treated as the same pattern. |
These distinctions matter because a pattern label should describe the visible structure. Parallel channel behavior, converging boundary behavior, and broader wedge behavior should not be treated as interchangeable.
What Can Weaken a Bear Flag Reading?
The bear flag label becomes less useful when the chart no longer shows a contained corrective pause. A shallow bounce after a decline is not automatically a flag. The structure needs enough reactions to make the boundaries meaningful.
- The prior decline is too small or too gradual to act as a flagpole.
- The correction retraces too much of the prior move.
- The boundaries are adjusted repeatedly to fit new candles.
- The flag becomes a broad range rather than a compact channel.
- Price accepts above the corrective structure instead of rejecting it.
- Volume and price behavior contradict the idea of a controlled pause.
Reliability questions should stay conditional. Pattern quality, context, and later market behavior matter more than the label itself. The same evidence discipline appears in bull flag reliability analysis, where structure quality is separated from any simple continuation assumption.
Bear Flag Pattern Example in Context
Price sells off sharply from a prior consolidation area, then pauses in a narrow upward-sloping channel. Several swings react near the upper and lower sides of the channel, but the recovery remains small compared with the earlier decline.
The bear flag interpretation is more defensible while the correction stays contained and price fails to reclaim the upper side of the flag with sustained acceptance. The structure loses value if the channel widens, the upper boundary holds as support after a breakout, or the recovery begins to erase the original bearish impulse.
Common Bear Flag Mistakes
The most common mistake is naming the pattern too early. A decline followed by one bounce is only a decline followed by one bounce. The flag structure needs a corrective area with enough boundary evidence to evaluate.
Common mistake: Drawing a bear flag after the market has already moved and then treating the fitted lines as if they were visible beforehand. Forced boundaries reduce the usefulness of the pattern label.
Another mistake is treating the flag as a trade plan. A chart pattern can help organize observation, but it does not define position size, risk, timing, or outcome. Those belong to a separate trading process, not to the pattern label itself.
FAQ
What is a bear flag pattern?
A bear flag pattern is a bearish continuation chart pattern with a sharp downward flagpole followed by a smaller corrective flag or channel.
How do you identify a bear flag?
Identify a bear flag by checking for a clear bearish impulse, a contained corrective channel, roughly parallel boundaries, and repeated reactions near those boundaries.
Is a bear flag always bearish?
A bear flag is a bearish structure by definition, but the label does not guarantee continuation. The reading can fail if price accepts above the corrective structure or the boundaries lose quality.
What makes a bear flag invalid?
A bear flag reading becomes invalid or forced when the flagpole is unclear, the correction becomes too wide, the boundaries are not coherent, or price accepts above the flag.
What is the difference between a bear flag and a pennant?
A bear flag usually has a small channel with roughly parallel boundaries, while a pennant is typically more compact and uses converging boundaries.