Renko vs candlestick chart comparison starts with construction. A candlestick chart organizes price by time and preserves open, high, low, and close behavior inside each interval. A Renko chart organizes price by selected brick-size movement and filters smaller movement until enough price change creates a completed brick.
Neither view is automatically better; the useful distinction is what each chart makes visible, what it hides, and how construction changes the evidence on the screen.
Key Points
- Renko charts organize price by selected brick-size movement, not by a fixed time interval.
- Candlestick charts organize price by time and preserve OHLC detail inside each candle.
- Renko can make trend structure look cleaner, but it can also hide time, path detail, and intra-brick movement.
- Candlesticks show more detail, but that detail can make minor fluctuations easier to overread.
- Neither Renko bricks nor candlestick patterns are standalone trading signals.
Renko vs Candlestick Chart: Core Difference
A candlestick chart answers a time-based question: what happened during this interval? Each candle preserves the open, high, low, and close for the chosen timeframe, so the chart keeps timing, wicks, bodies, and sequence density visible.
A Renko chart answers a threshold-based question: did price move far enough to complete another brick? The selected brick size controls what counts as visible movement. Price movement below that threshold may not create a new brick even if activity occurred between completed bricks.
Core distinction: candlesticks preserve time-based OHLC behavior, while Renko charts convert price movement into completed bricks based on a selected movement threshold.
How Construction Changes What You See
Chart construction changes the visible evidence. A candlestick chart prints a candle when the selected time interval ends. A Renko chart prints a brick when price satisfies the selected brick-size rule. The same market movement can therefore look detailed, noisy, clean, delayed, or compressed depending on the chart type and settings.
On a candlestick chart, a sharp move up, a deep pullback, and a late recovery can all remain visible inside a small group of candles. On a Renko chart, the same movement may appear as fewer completed bricks if the pullback or recovery did not satisfy the brick threshold.
Setting sensitivity: changing the candlestick timeframe changes the OHLC intervals. Changing the Renko brick size changes which price movement becomes visible as completed structure.
Criteria Table: Renko vs Candlestick Chart
| Criterion | Renko chart | Candlestick chart |
|---|---|---|
| Construction basis | Selected brick-size movement | Selected time interval |
| Time handling | Time is visually filtered, compressed, or uneven between bricks | Time is explicit because each candle belongs to a defined interval |
| Data preserved | Completed threshold movement and brick direction | Open, high, low, close, wick behavior, body size, and timing |
| Movement filtered | Movement below the brick threshold may not appear as a new brick | Smaller movement remains visible inside candles and wicks |
| Trend readability | Can look cleaner after smaller movement is filtered | Can look noisier because more movement detail remains visible |
| Reversal interpretation | Depends on brick rule, brick size, and completed sequence | Depends on candle sequence, wicks, closes, location, and broader context |
| Sensitivity setting | Brick size can materially change the visible structure | Timeframe can materially change the visible structure |
| False-equivalence risk | A cleaner brick sequence can create false clarity if hidden movement matters | A detailed candle sequence can create false urgency if minor noise is overread |
| Best diagnostic use | Filtering structure and checking whether movement completed the selected threshold | Reading detailed price behavior, timing, volatility, wicks, and closes |
| Main limitation | Hides time spacing, some path detail, and intra-brick behavior | Preserves more information, but not all information is equally useful |
| Not a signal | A brick color change is not automatic confirmation | A candle pattern or wick is not automatic confirmation |
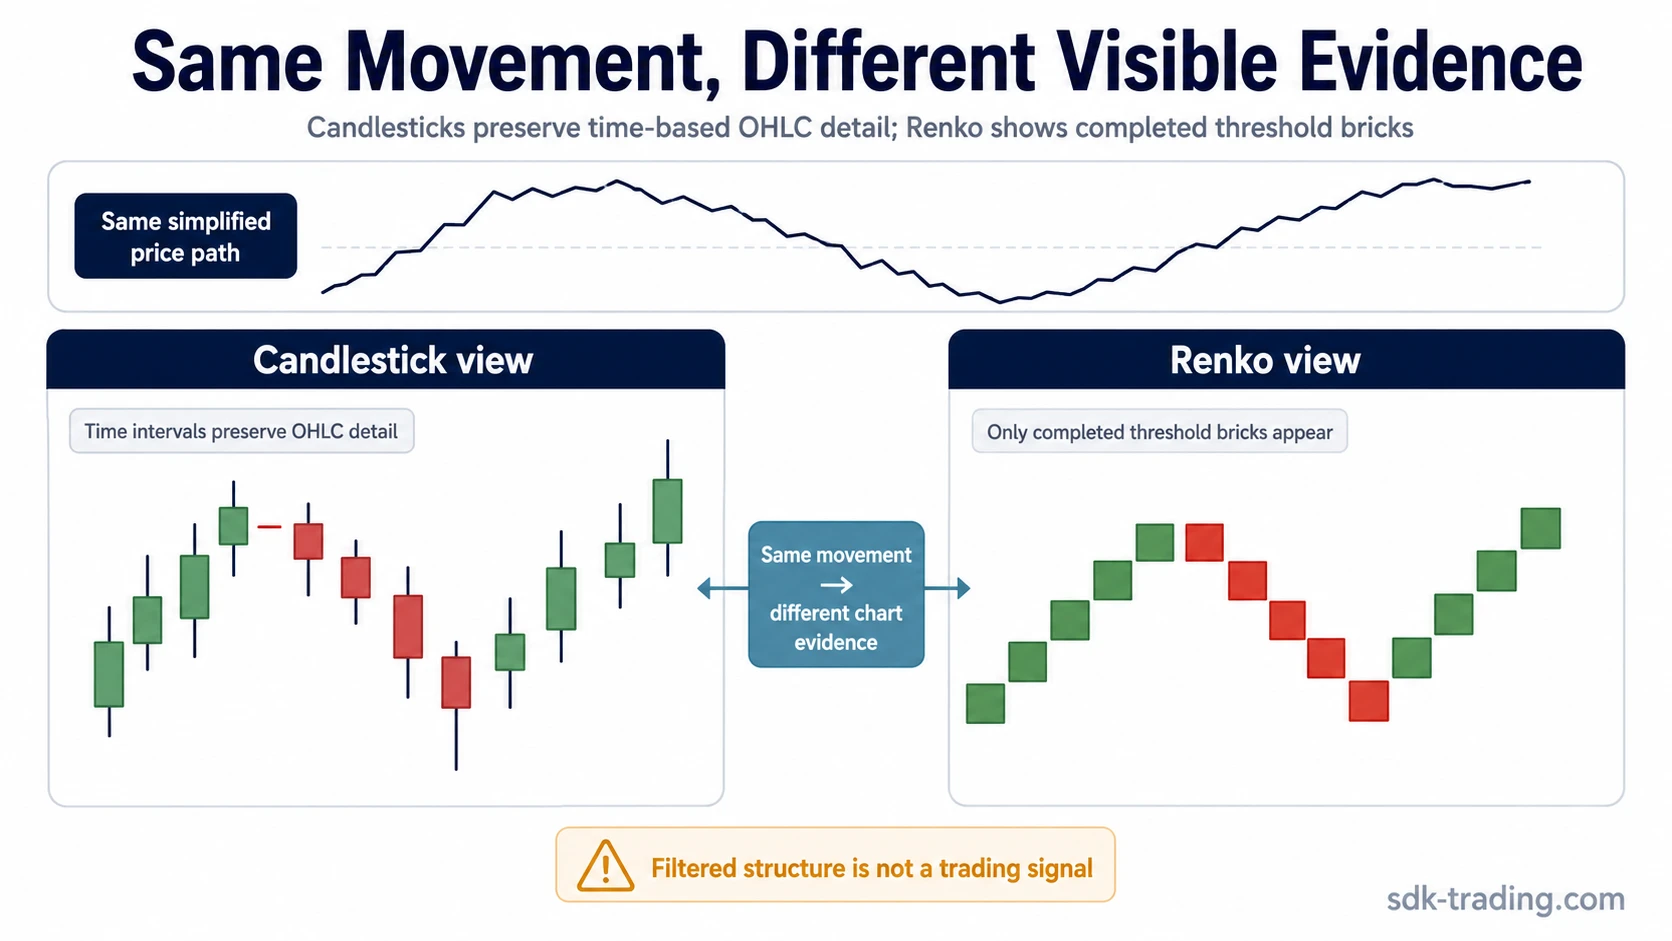
Same Price Path, Different Visible Structure
Illustrative comparison: price advances, pulls back inside the move, then closes higher. A candlestick view can show the advance, the pullback wick, the candle body, the recovery, and the time sequence between those events. A Renko view may show only the completed bricks if the pullback did not travel far enough to create a reversal brick.
The candlestick version preserves more path detail. The Renko version emphasizes whether price completed enough threshold movement to extend or reverse the brick sequence. Both views describe the same simplified price path, but they do not preserve the same evidence.
This is why a Renko chart can make a move look smoother while a candlestick chart can make the same move look more contested. The smoother view may reduce distraction, but it may also remove information that matters for timing, volatility, or failed movement. The detailed view may preserve useful context, but it may also invite over-reading every wick or small body.
What Renko Preserves, Filters, and Hides
Renko preserves completed threshold movement. If price moves far enough to satisfy the selected brick-size rule, the chart can add a new brick. If price remains inside the threshold, that movement may not appear as a new brick.
That construction can make directional structure easier to see because smaller movement is filtered out. The tradeoff is information loss. Time between bricks can become uneven, intra-brick highs and lows may disappear from the visible structure, and a trader may see a clean brick sequence without seeing the path that produced it.
Limitation: cleaner structure can also mean less visible information. A filtered structure is not the same thing as a trading signal.
What Candlestick Charts Preserve, and Why That Can Add Noise
Candlestick charts preserve more of the price path inside each chosen interval. The open, high, low, and close can show whether price rejected an area, expanded through it, stalled, or closed near one side of the interval. Wicks and bodies can make volatility and failed movement visible.
The weakness is that more visible information can create more visual noise. A single wick, small body, or short candle sequence can look meaningful even when broader structure remains unresolved. Candlestick detail is useful only when location, sequence, and confirmation support the interpretation.
Interpretation boundary: candlesticks preserve more evidence, but more evidence does not automatically mean clearer evidence.
When Renko Can Be Useful
Renko can be useful when the main task is to reduce smaller movement and focus on completed directional structure. It can make trend continuation, pauses, and threshold-based reversals easier to separate from minor fluctuation.
The usefulness depends on the selected brick size. A small brick size can make the chart more reactive and show more reversals. A larger brick size can filter more movement but may delay visible changes. The right interpretation depends on the purpose of the chart, the instrument’s movement profile, and the need for confirmation outside the brick sequence.
For the underlying construction logic, see Renko chart. For setting sensitivity, see Renko brick size.
When Candlesticks Can Be More Useful
Candlesticks can be more useful when timing and intra-period behavior matter. A candle can show whether price opened weak and closed strong, tested below a level and recovered, or expanded with a wide body after a narrow range.
This detail can help compare attempted movement with accepted movement. It can also show when a move had volatility inside it rather than a smooth path. The cost is that the chart may contain many small signals that do not matter without broader structure.
For detailed candle reading, see how to read candlestick charts.
Common Misreads
| Misread | Safer interpretation |
|---|---|
| Renko looks cleaner, so it must be better | Cleaner structure may reflect useful filtering, but it can also hide time and path detail. |
| A Renko color change confirms reversal | A color change only shows that the selected brick rule was met. It does not confirm the broader context by itself. |
| A candlestick wick proves rejection | A wick begins the question. The close, follow-through, location, and later acceptance behavior decide the reading. |
| More candle detail always improves analysis | More detail can help, but it can also make noise easier to overread. |
| One Renko brick size or candle timeframe is always best | Settings change the visible structure. A setting should match the diagnostic question, not replace judgment. |
Related Chart Concepts
Renko chart construction, Renko brick size, candlestick chart reading, and strategy use are separate questions. The chart type controls what is visible. A strategy framework controls how evidence is combined with context, confirmation, invalidation, and risk.
- Renko chart: the core non-time-based chart type built from completed brick movement.
- Renko brick size: the setting that controls how much movement is required before a brick appears.
- Candlestick chart reading: the time-based OHLC layer used to read bodies, wicks, closes, and sequence.
- Renko trading strategy: a separate framework question; a brick sequence alone is not a complete strategy.
FAQ
Is Renko better than candlestick charts?
Renko is not automatically better than candlestick charts. Renko filters smaller movement and can make structure cleaner, while candlesticks preserve more time-based OHLC detail. The better view depends on what evidence needs to remain visible.
Why can Renko and candlestick charts show the same move differently?
They use different construction rules. Candlesticks print by time interval and preserve open, high, low, and close behavior. Renko prints only when price satisfies the selected brick-size movement rule.
Does Renko remove time completely?
Renko does not remove time from the market, but it does not display time the same way a candlestick chart does. Bricks appear after threshold movement, so spacing between visible bricks can compress or hide elapsed time.
Can traders use Renko and candlestick charts together?
They can be compared together as different evidence views. Renko can filter structure, while candlesticks can show time-based detail. Using both still requires context, confirmation, and risk control.