Market breadth indicators measure how many stocks or components participate behind a market move. A rising index can still hide weak participation underneath it, while a falling index can still contain pockets of strength. The reading is incomplete until the indicator family, market universe, timing, threshold, and index concentration are checked.
Definition: Market breadth indicators are participation tools that compare the movement of many stocks or index components with the movement of a headline market index. They help show whether a move is broad, narrow, divergent, or mixed.
In trading analysis, breadth separates headline index movement from underlying participation. It can warn that a move is becoming narrow, broadening, or internally conflicted, but it does not confirm a trade, reversal, continuation, entry, exit, or forecast by itself.
Key Points
- Market breadth indicators measure participation across stocks or index components, not only the movement of the headline index.
- Different breadth indicators count different inputs, such as advances, declines, new highs, new lows, volume pressure, or moving-average participation.
- A breadth reading becomes safer when it is checked against universe selection, data timing, index concentration, and persistence.
- Divergence can be a warning condition, but it should not be treated as a standalone trading instruction.
What Market Breadth Indicators Measure
Market breadth indicators measure participation across a market group. Instead of asking only whether an index rose or fell, they ask how many underlying stocks contributed to that move.
A broad advance usually means more stocks are participating in the same direction as the index. A narrow advance means the index may be rising because a smaller group of large or influential components is carrying more of the movement.
The same distinction works in falling markets. A broad decline shows weakness across many components. A narrower decline can mean the headline index is weak, but participation is less uniformly negative underneath the surface.
Why Breadth Readings Can Mislead
A breadth reading can be accurate as a calculation and still be weak as an interpretation. The problem usually comes from reading the number without asking what it counts and what market universe it represents.
For example, a large-cap index can rise while fewer stocks participate if a small group of heavily weighted names drives the index higher. A breadth indicator may flag narrowing participation, but the signal remains a warning until persistence, leadership, and broader market context support the interpretation.
The reverse can also happen. An index can look weak while some groups begin improving beneath the surface. That improvement may matter, but it does not confirm a durable turn by itself. Breadth adds context; it does not replace trend, structure, liquidity, risk conditions, or the specific mechanics of each indicator.
Main Types of Market Breadth Indicators
Market breadth indicators are a family of participation measures. The safest reading starts by identifying the input being counted before interpreting the result.
| Indicator type | What it counts | Common misread | Safer reading |
|---|---|---|---|
| Advance-Decline Line | Net advancing stocks versus declining stocks over time | Treating one daily move as confirmation | Use the Advance-Decline Line to evaluate persistence in participation, not a single isolated reading. |
| New Highs-New Lows | Stocks making fresh highs compared with stocks making fresh lows | Assuming deterioration means an immediate reversal | Use New Highs-New Lows as a leadership breadth warning, then compare it with trend and participation context. |
| TRIN / Arms Index | Volume pressure relative to advancing and declining issues | Reading one extreme as a direct trade signal | Use the TRIN / Arms Index to judge breadth pressure, then check whether the pressure is broad, temporary, or distorted by volume concentration. |
| McClellan Oscillator | Momentum of advancing versus declining issues | Treating oscillator movement as standalone timing | Compare momentum changes with breadth persistence, trend behavior, and the data source behind the calculation. |
| Percentage above moving averages | The share of stocks trading above a selected moving average | Assuming a high or low percentage is automatically bullish or bearish | Compare the percentage with index concentration, regime context, and whether participation is broadening or narrowing. |
How to Read Breadth Indicators Safely
A safer breadth reading follows a simple diagnostic sequence: identify what is counted, compare it with the index move, check the market universe, then decide whether the condition is persistent or isolated.
| Check | Question to ask | Why it changes the reading |
|---|---|---|
| Input | Does the indicator count advances, declines, highs, lows, volume, or moving-average participation? | Different inputs describe different forms of participation. |
| Universe | Is the reading based on the whole exchange, a sector, an index, or a custom list? | A broad-market reading and an index-component reading can give different messages. |
| Timing | Is the value preliminary, intraday, end-of-day, or final? | Early values can change, especially around volatile sessions or incomplete data feeds. |
| Concentration | Is a small group of large components driving the index? | Cap-weighted index movement can hide weaker equal-weighted participation. |
| Persistence | Is the breadth condition repeating or appearing only once? | One reading is weaker than a repeated participation pattern. |
A breadth reading becomes more useful when several checks point in the same direction. It becomes weaker when the index move, participation data, leadership behavior, and timing evidence disagree.
Breadth Divergence and Narrow Leadership
A common breadth scenario begins with a headline index pushing higher while fewer stocks make progress underneath it. The index movement can look strong, but participation may be narrowing if fewer components are advancing or fewer stocks are making new highs.
The tempting interpretation is to call the move fragile immediately. That may be too strong. Narrow leadership can persist, especially when large components dominate a cap-weighted index. A safer interpretation is that the market advance has become more dependent on fewer participants, so the reading needs confirmation from related participation evidence.
A stronger warning develops when narrow participation persists across several readings, leadership stops expanding, and related breadth measures show the same deterioration. The warning weakens if participation broadens again, new highs expand, or the prior divergence disappears as more stocks join the move.
Ordinary Breadth Readings vs Breadth Thrusts
Most breadth readings describe participation at a point in time or across a short sequence. A breadth thrust is different because it focuses on a rapid expansion in participation over a defined window.
The Zweig Breadth Thrust is a specific participation-thrust measure, not a generic label for any strong breadth day. Ordinary breadth strength can show broad participation, but a named thrust indicator needs its own calculation rules and threshold logic.
Data Quality and Calculation Caveats
Breadth indicators are only as clean as their input data. Readings can vary by exchange, index membership, data provider, calculation method, and update timing.
Universe dependency: A reading based on all listed stocks can differ from a reading based only on index components.
Timing dependency: Preliminary intraday values can differ from final values, especially during volatile sessions or incomplete data feeds.
Index concentration: A cap-weighted index can rise even when equal-weighted participation is weaker.
Sector distortion: A sector-heavy market can distort the message if one group dominates the move.
These caveats do not make breadth useless. They make the reading conditional. The same number can mean different things depending on what was counted, when it was measured, and whether the headline index is being lifted by broad participation or concentrated leadership.
Common Mistakes With Breadth Indicators
The most common mistake is treating one breadth reading as confirmation. A single strong or weak value can be informative, but it is not a complete market view.
- Reading divergence as a forecast: Divergence can warn that participation is changing, but it does not specify timing or guarantee a reversal.
- Ignoring the market universe: A reading from one index or exchange may not describe the whole stock market.
- Using thresholds mechanically: A threshold can organize interpretation, but the same threshold can behave differently across regimes and data sets.
- Confusing market context with trade action: A market view and a trade expression are separate decisions. Breadth can improve context without becoming an instruction.
- Overlooking index concentration: A few large components can move the headline index while broader participation remains weaker.
Market Breadth Indicator Reading Map
Use the raw value as the start of interpretation, not the end of it.
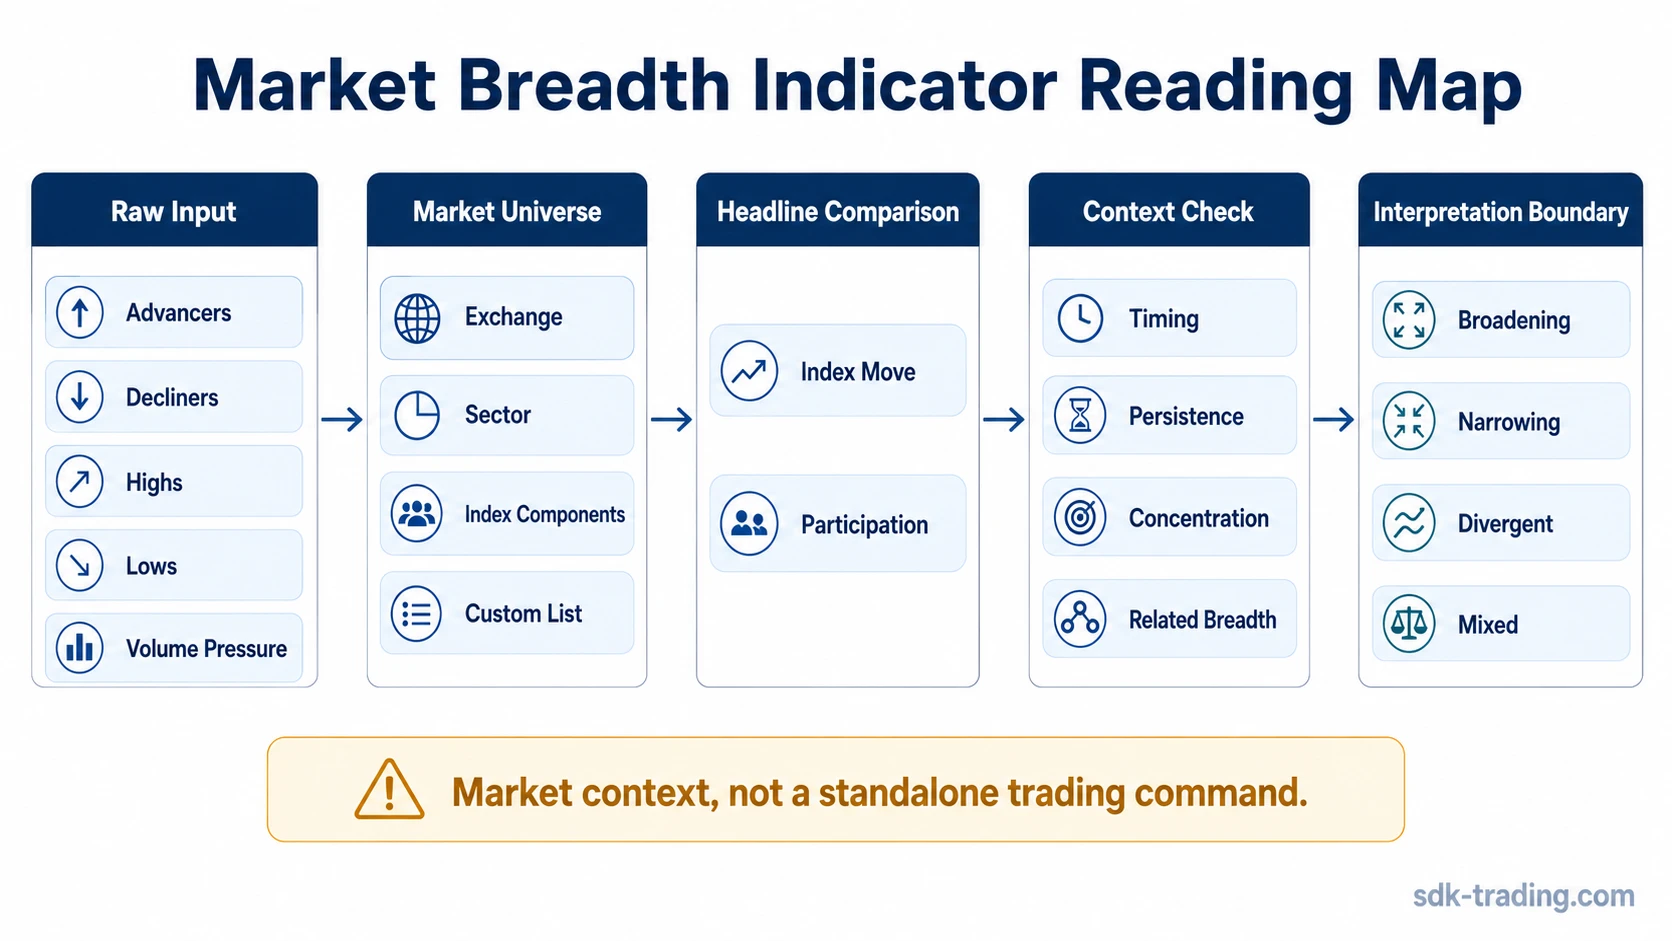
| Reading step | What to check | Safer boundary |
|---|---|---|
| Raw input | Advancers, decliners, highs, lows, volume pressure, or moving-average participation | Do not compare indicators as if they count the same thing. |
| Market universe | Exchange, sector, index components, or custom list | Do not treat a narrow universe as the whole market. |
| Headline comparison | Whether index movement agrees with participation | Do not call disagreement a confirmed reversal. |
| Context check | Timing, persistence, concentration, trend, and related breadth measures | Do not overread one value without supporting evidence. |
| Interpretation | Broadening, narrowing, divergent, or mixed participation | Treat the result as market context, not a standalone trading command. |
FAQ
What is a market breadth indicator?
A market breadth indicator is a participation measure that compares the movement of many stocks or components with the movement of a market index or group. It helps identify whether a move is broad, narrow, divergent, or mixed.
Which indicators measure market breadth?
Common market breadth indicators include the Advance-Decline Line, New Highs-New Lows, TRIN / Arms Index, McClellan Oscillator, and the percentage of stocks above selected moving averages.
Can market breadth indicators predict reversals?
No. Breadth indicators can warn that participation is weakening or improving, but they do not predict reversals by themselves. A safer reading checks persistence, market universe, data quality, concentration, and related market context.