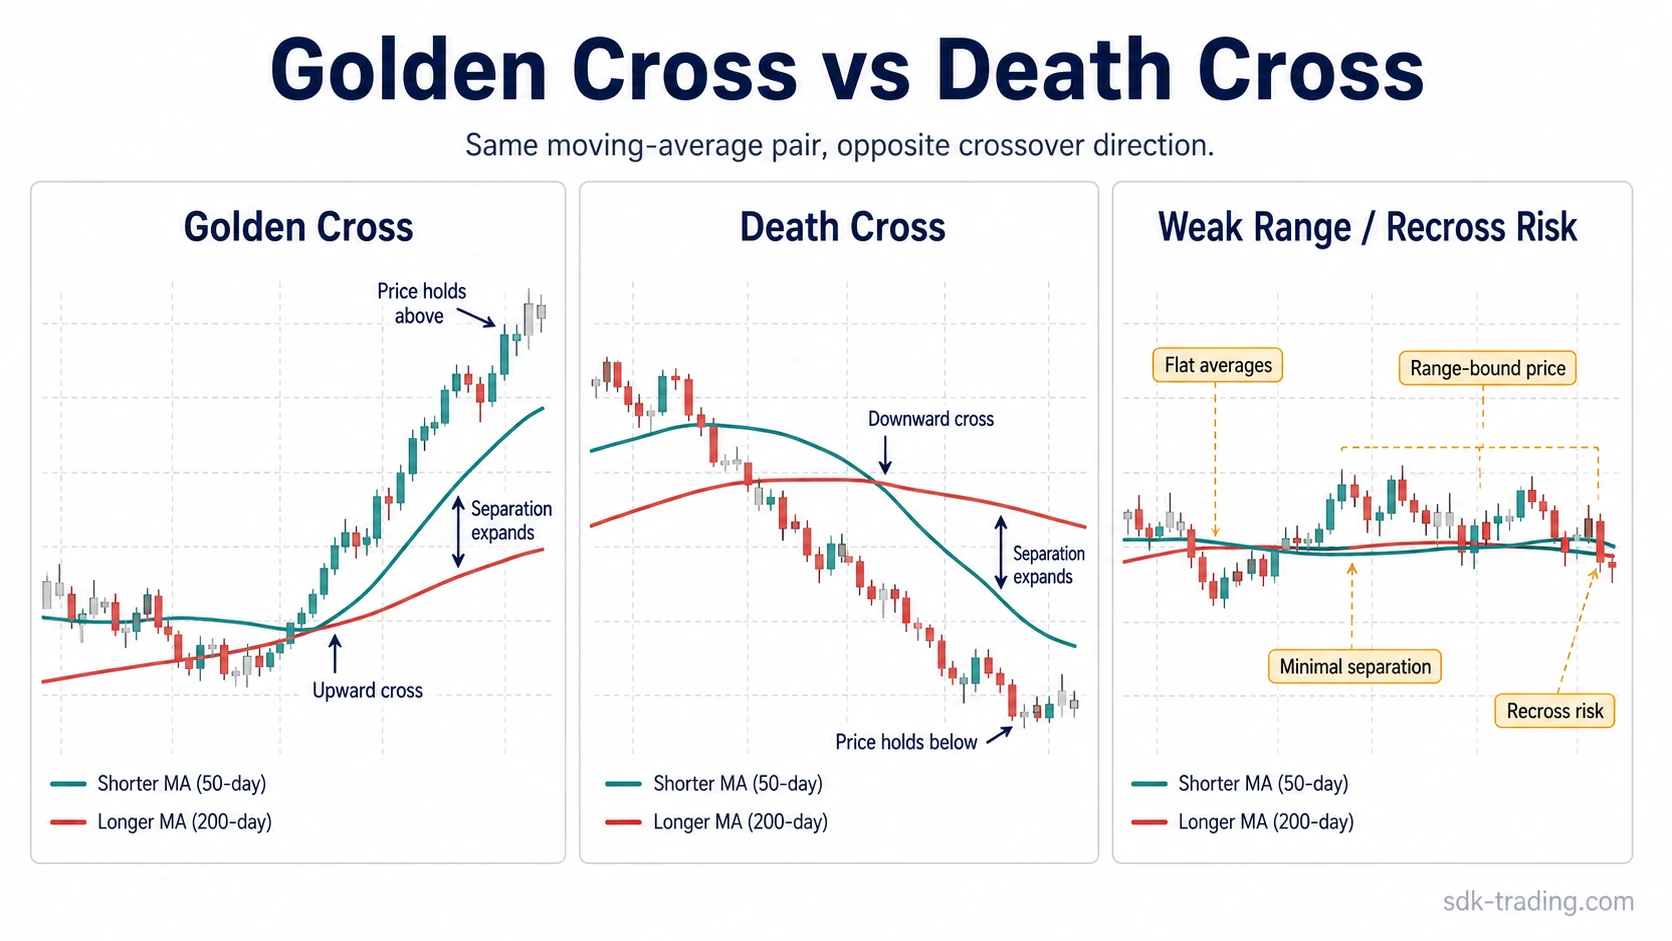
Golden Cross vs Death Cross compares two opposite moving-average crossover readings: a golden cross forms when a shorter moving average crosses above a longer moving average, while a death cross forms when the shorter average crosses below it.
A Golden Cross points to upward realignment in the moving-average structure after recent prices have improved relative to the longer trend measure.
A Death Cross points to downward realignment after recent prices have weakened relative to the longer trend measure.
Definition: Both readings usually use a shorter moving average and a longer moving average, commonly the 50-day and 200-day moving averages. The comparison is not about which one is stronger by default; it is about direction, slope, separation, price acceptance, and whether the crossover happens inside a clean trend or a noisy range.
Key Points
- A golden cross is the upward version of the crossover; a death cross is the downward version.
- The 50-day and 200-day moving averages are common defaults, but the same logic can apply to other shorter and longer averages.
- Both readings lag because moving averages respond after price has already shifted.
- Flat averages, shallow separation, and sideways price rotation make either crossover less useful.
- The comparison works best when the crossover is read as structure evidence, not as a mechanical instruction.
Golden Cross vs Death Cross: Key Differences
The core difference is direction. A golden cross means the shorter average has moved above the longer average; a death cross means the shorter average has moved below it. The same moving-average pair can therefore describe opposite realignments depending on how price resolves around the averages.
| Comparison point | Golden cross | Death cross |
|---|---|---|
| Direction | Shorter moving average crosses above the longer moving average. | Shorter moving average crosses below the longer moving average. |
| Common setup | Often described with the 50-day average crossing above the 200-day average. | Often described with the 50-day average crossing below the 200-day average. |
| Recent price behavior | Recent prices have improved enough to pull the shorter average upward. | Recent prices have weakened enough to pull the shorter average downward. |
| Cleaner reading | The interpretation gains support when slope, separation, and price acceptance improve after the cross. | The interpretation gains support when slope, separation, and downside acceptance expand after the cross. |
| Fragile reading | The cross remains fragile when both averages stay flat and price remains trapped in a range. | The cross remains fragile when both averages stay flat and price remains trapped in a range. |
| Lag issue | May appear after a large part of the upward move has already occurred. | May appear after a large part of the downward move has already occurred. |
| Recross risk | Higher when the shorter average barely clears the longer average. | Higher when the shorter average barely breaks below the longer average. |
Where Golden Cross and Death Cross Overlap
Both readings belong to the broader moving average crossover family. They compare a faster average against a slower average to show whether recent price behavior is moving above or below the longer trend measure.
The overlap matters because neither reading comes from a separate indicator. The same two-line framework produces both outcomes. The shorter average reacts faster to recent price changes, while the longer average smooths more history and changes direction more slowly.
Shared framework: both readings use a faster average, a slower average, and the relationship between them.
Different interpretation: the meaning changes when the faster average crosses upward or downward, and when later price behavior either accepts or rejects that shift.
Where the Interpretation Diverges
A golden cross is usually read as improving trend alignment because recent price behavior has lifted the shorter moving average above the longer one. That interpretation is clearer when price holds above the averages, the shorter average turns upward, and the distance between the two averages expands.
A death cross is usually read as deteriorating trend alignment because recent price behavior has pulled the shorter moving average below the longer one. That interpretation is clearer when price remains below the averages, the shorter average slopes lower, and the separation between the averages expands.
The divergence is not only the crossing point. A shallow cross with flat averages can look dramatic on a chart but still represent little more than sideways compression. A cleaner interpretation needs the crossover, the slope of both averages, and later price behavior to point in the same direction.
Same Moving Averages, Different Meaning
Price can spend several weeks rotating around a flat 50-day and 200-day moving average. During that compression, the shorter average may approach the longer average from either side without creating a clean trend reading.
Example of a basic golden cross vs death cross reading: price begins closing above the upper side of the range while the 50-day average turns upward toward the 200-day average. If the 50-day average crosses above the 200-day average, that creates a golden cross reading, but the interpretation still depends on whether price acceptance and separation continue after the cross.
If later rotations fail at the upper side of the range and price starts closing below the lower side instead, the 50-day average may turn down and cross below the 200-day average. That creates a death cross reading, but the crossover remains unresolved if price quickly moves back into the range and the averages stay flat.
The useful comparison is that the moving-average pair is the same, but the resolution path changes the reading. Upward acceptance supports the golden-cross interpretation. Downward acceptance supports the death-cross interpretation. Continued sideways rotation leaves both readings vulnerable to recross.
When Both Crosses Become Less Reliable
Both crosses become less useful when the market is range-bound. In a range, price can repeatedly move above and below the same moving averages without establishing a clear directional structure.
| Condition | Why it weakens the reading | What to compare next |
|---|---|---|
| Flat moving averages | The crossover may reflect sideways compression rather than directional change. | Check whether either average is beginning to slope clearly. |
| Minimal separation | A small gap between averages increases the chance of another quick cross. | Compare whether separation expands or immediately narrows again. |
| Range-bound price | Repeated rotations through the averages can create whipsaw readings. | Check whether price accepts outside the range or returns inside it. |
| Fast recross | The first crossover did not hold long enough to show durable realignment. | Compare the recross with slope, structure, and follow-through. |
| Low follow-through | Price does not continue in the direction implied by the crossover. | Check whether later candles confirm acceptance or reject the move. |
Lag is the other shared limitation. Moving averages are calculated from prior prices, so a crossover can appear after the strongest part of a move has already happened. That does not make the reading useless, but it does make the timing less precise than the chart may imply.
How to Read the Comparison as Evidence, Not Instruction
A cleaner golden cross or death cross reading usually has more than a single line crossing another line. Slope, separation, and price acceptance should support the same interpretation. If those inputs disagree, the crossover is better treated as incomplete evidence.
| Reading quality | Golden cross context | Death cross context |
|---|---|---|
| Cleaner | Shorter average crosses upward, both averages begin separating, and price holds above the crossover area. | Shorter average crosses downward, both averages begin separating, and price holds below the crossover area. |
| Mixed | The cross appears, but the longer average remains flat and price has not held above the range. | The cross appears, but the longer average remains flat and price has not held below the range. |
| Weak | The shorter average barely crosses upward and quickly rolls back toward the longer average. | The shorter average barely crosses downward and quickly turns back toward the longer average. |
The comparison is most useful when it separates structure from action. A crossover can describe how price has realigned around moving averages, but it does not define position size, timing, risk, or outcome on its own.
Related Moving-Average Concepts
Golden cross and death cross readings are easier to compare when the shared crossover mechanism is clear first. The upward version, downward version, and broader crossover family each answer a different question.
- Golden cross: focuses on the upward crossover and what makes that realignment cleaner or weaker.
- Death cross: focuses on the downward crossover and why lag, flat slope, and recross risk matter.
- Moving average crossover: explains the broader relationship between shorter and longer averages before the reading is labeled as golden or death.
FAQ
What is the main difference between a golden cross and a death cross?
A golden cross forms when a shorter moving average crosses above a longer moving average. A death cross forms when the shorter moving average crosses below the longer moving average.
Do golden crosses and death crosses always use the 50-day and 200-day moving averages?
No. The 50-day and 200-day moving averages are common defaults, but the same shorter-versus-longer moving-average logic can be applied to other periods.
Why can both crosses fail in sideways markets?
Sideways markets can keep price rotating around flat moving averages. That can create shallow crosses, quick recrosses, and weak separation instead of a clean directional reading.
Is a moving average crossover the same as a golden cross or death cross?
A moving average crossover is the broader mechanism. A golden cross and a death cross are specific crossover labels based on whether the shorter average crosses above or below the longer average.