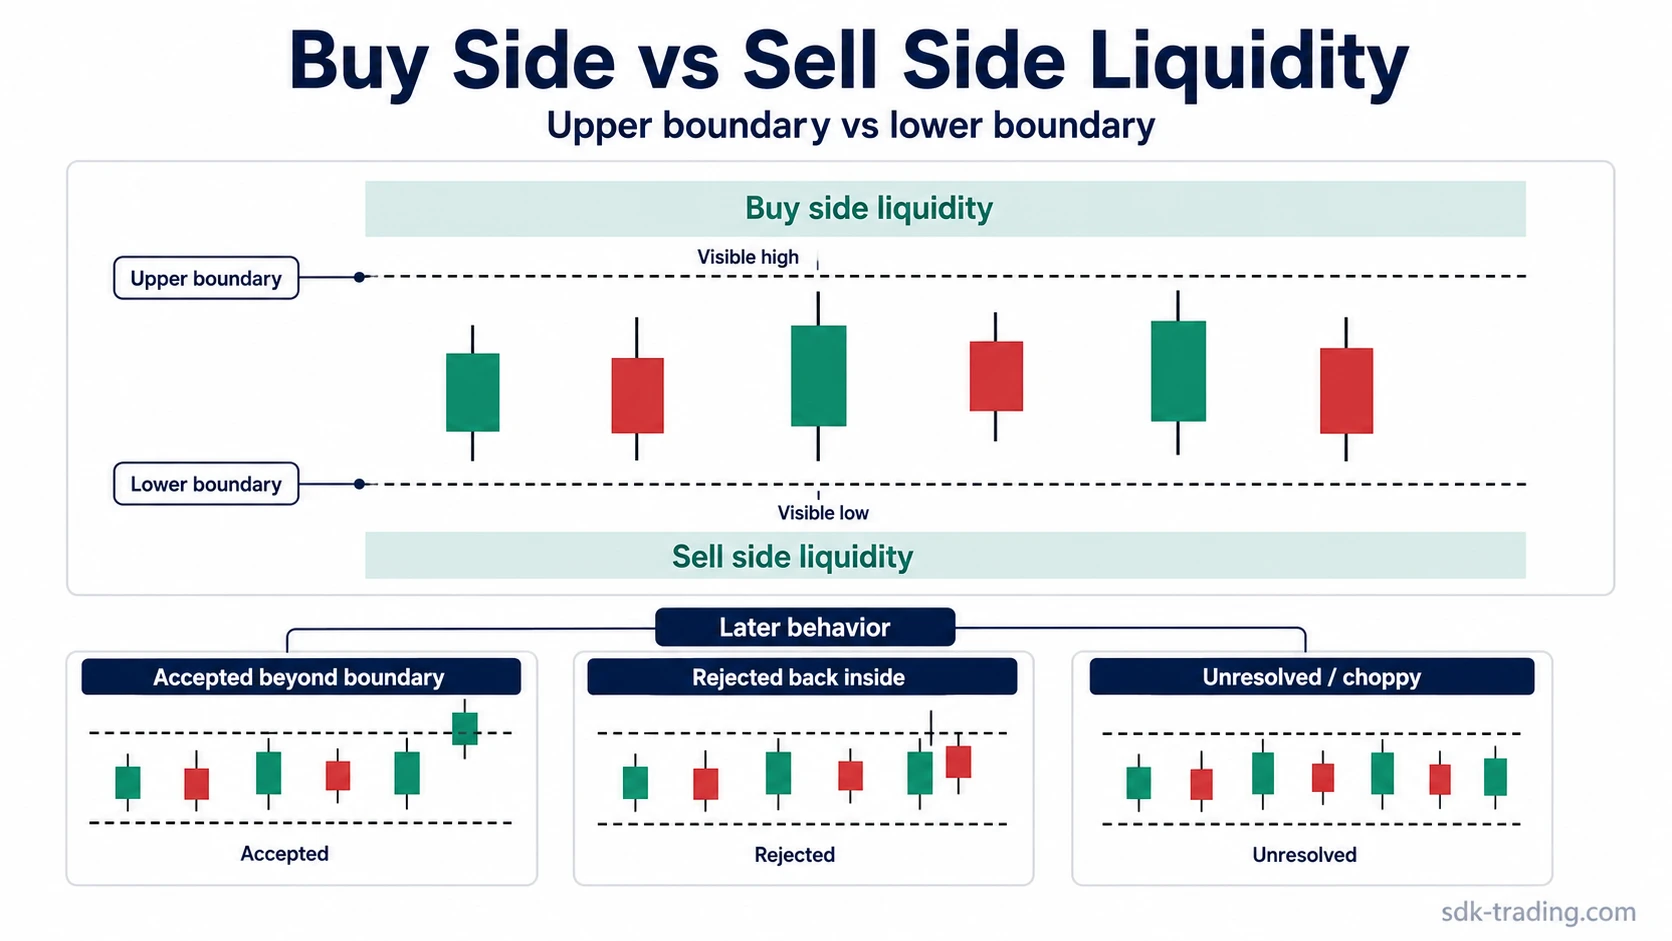
Buy side liquidity refers to likely buy-stop or breakout-order clusters above visible highs or resistance. Sell side liquidity refers to likely sell-stop or breakdown-order clusters below visible lows or support.
The useful distinction is the side of the chart being referenced. Buy-side liquidity points to liquidity above the market.
Sell-side liquidity points to liquidity below the market, so the relevant label changes with the boundary being discussed.
Both ideas describe chart-side liquidity, not a trade signal. A level can attract attention without proving that price must reverse, continue, sweep, or reject from that area.
Key Points
- Buy side liquidity is usually discussed above visible highs, swing highs, or resistance.
- Sell side liquidity is usually discussed below visible lows, swing lows, or support.
- The same chart can contain both; the relevant reading depends on which boundary price is approaching or testing.
- Neither side confirms direction by itself. Later price behavior determines whether the level was accepted, rejected, or left unresolved.
What Is the Difference Between Buy Side and Sell Side Liquidity?
The difference between buy side and sell side liquidity is location. Buy side liquidity sits above visible chart highs, where breakout orders and buy stops may be clustered. Sell side liquidity sits below visible chart lows, where breakdown orders and sell stops may be clustered.
The terms can sound directional, but they are mainly reference labels. Buy side does not automatically mean bullish, and sell side does not automatically mean bearish. The label describes the side of the structure where liquidity may be resting.
Simple distinction: buy side liquidity is liquidity above price; sell side liquidity is liquidity below price. The reading becomes more useful when the reference high or low is visible enough for many participants to watch it.
Buy Side vs Sell Side Liquidity Criteria
The comparison starts with the chart boundary. The first question is which side of structure is being discussed. The second question is what kind of order cluster may sit beyond that boundary.
| Criteria | Buy Side Liquidity | Sell Side Liquidity |
|---|---|---|
| Chart side | Above the current market or above a visible reference high. | Below the current market or below a visible reference low. |
| Typical location | Above swing highs, range highs, resistance, equal highs, or prior breakout areas. | Below swing lows, range lows, support, equal lows, or prior breakdown areas. |
| Likely order cluster | Buy stops from short positions and breakout orders from traders waiting above resistance. | Sell stops from long positions and breakdown orders from traders waiting below support. |
| Common reference level | A high that is obvious enough to attract attention. | A low that is obvious enough to attract attention. |
| What the phrase usually points to | Liquidity resting above a watched upper boundary. | Liquidity resting below a watched lower boundary. |
| How it can be misread | Calling every move above a high a confirmed reversal, breakout, or trap too early. | Calling every move below a low a confirmed breakdown, reversal, or trap too early. |
| Use this lens when… | Price is approaching, probing, or reacting around a visible upper boundary. | Price is approaching, probing, or reacting around a visible lower boundary. |
| Do not assume… | That liquidity above a high guarantees rejection, continuation, or an actionable setup. | That liquidity below a low guarantees rejection, continuation, or an actionable setup. |
Same Chart, Different Liquidity Reading
A range can have clear highs and clear lows at the same time. When price is moving toward the highs, the relevant reading is buy side liquidity above the range. When price is moving toward the lows, the relevant reading is sell side liquidity below the range.
Illustrative scenario: price holds inside a range for several sessions. The upper boundary becomes a visible high, and the lower boundary becomes a visible low. A move into the upper boundary focuses attention on buy-stop and breakout liquidity above the range. A move into the lower boundary focuses attention on sell-stop and breakdown liquidity below the range.
The chart did not change categories. The diagnostic side changed because price moved toward a different boundary.
When the Comparison Is Misread
The most common mistake is treating buy side and sell side liquidity as mirror-image predictions. They are opposite sides of structure, but neither side tells the full story by itself.
Misread: price trades above a high, so the move must be a reversal or a trap.
Cleaner reading: price has interacted with buy side liquidity. The interpretation remains unresolved until later behavior shows acceptance above the high, rejection back below it, or continued chop around the boundary.
Misread: price trades below a low, so the move must be a breakdown or a reversal.
Cleaner reading: price has interacted with sell side liquidity. The reading depends on whether later behavior accepts below the low, rejects back above it, or fails to create a clear result.
The comparison is strongest when the reference high or low is visible, the boundary has attracted repeated attention, and later behavior gives enough evidence to separate acceptance from failure.
How This Relates to Sweeps, Stop Hunting, and Swing Failures
Buy side and sell side liquidity describe where liquidity may sit. A liquidity sweep describes an interaction with that area. The two ideas are connected, but they are not the same reading.
Stop hunting is often discussed when price moves beyond visible highs or lows where stops may be clustered. The safer interpretation is still conditional: a stop cluster can be targeted without proving intent, outcome, or trade quality.
A swing failure reading becomes more specific only after price probes a prior swing and then fails to hold beyond it. Without that later failure behavior, the move is only an interaction with a watched boundary.
Boundary rule: liquidity location comes first. Sweep, failure, rejection, or acceptance language should come only after price behavior gives enough evidence for that narrower reading.
When to Use Each Term
A cleaner comparison starts with visible structure and ends with later behavior. The reading is weaker when the level is vague, the boundary was not watched, or price action after the test remains unresolved.
| Question | Why It Matters |
|---|---|
| Is the reference high or low visible? | A hidden or arbitrary level is less likely to represent a meaningful liquidity area. |
| Which side of the structure is being tested? | The upper boundary points to buy side liquidity; the lower boundary points to sell side liquidity. |
| Did price only touch the area, or did it accept beyond it? | A brief probe and sustained acceptance are different behaviors. |
| Is later behavior clear or unresolved? | Unresolved movement should not be forced into a trap, reversal, or continuation label. |
FAQ
Is buy side liquidity bullish or bearish?
Buy side liquidity is not automatically bullish or bearish. It describes liquidity above visible highs or resistance. The later reaction around that area determines whether the move is accepted, rejected, or unresolved.
Is sell side liquidity the same as selling pressure?
No. Sell side liquidity usually refers to potential stop or breakdown-order clusters below lows or support. Selling pressure describes active market behavior, while sell side liquidity describes a possible location of resting orders.
Can the same chart have both buy side and sell side liquidity?
Yes. A range can have buy side liquidity above its highs and sell side liquidity below its lows. The relevant label depends on which boundary price is approaching or testing.
Is this the same as buy-side and sell-side firms?
No. In this price-action context, the terms describe liquidity areas above and below visible chart levels, not institutional firm categories.