Bearish candlestick patterns are candle formations that can show failed higher acceptance, upside rejection, renewed supply, or downside continuation. The pattern name is useful only when price rejects the tested area and later behavior fails to rebuild acceptance above it.
A red candle alone does not prove that sellers control the chart. The stronger question is whether price tested an area where supply could matter, failed to hold higher levels, and then could not recover the rejected area.
Key Points
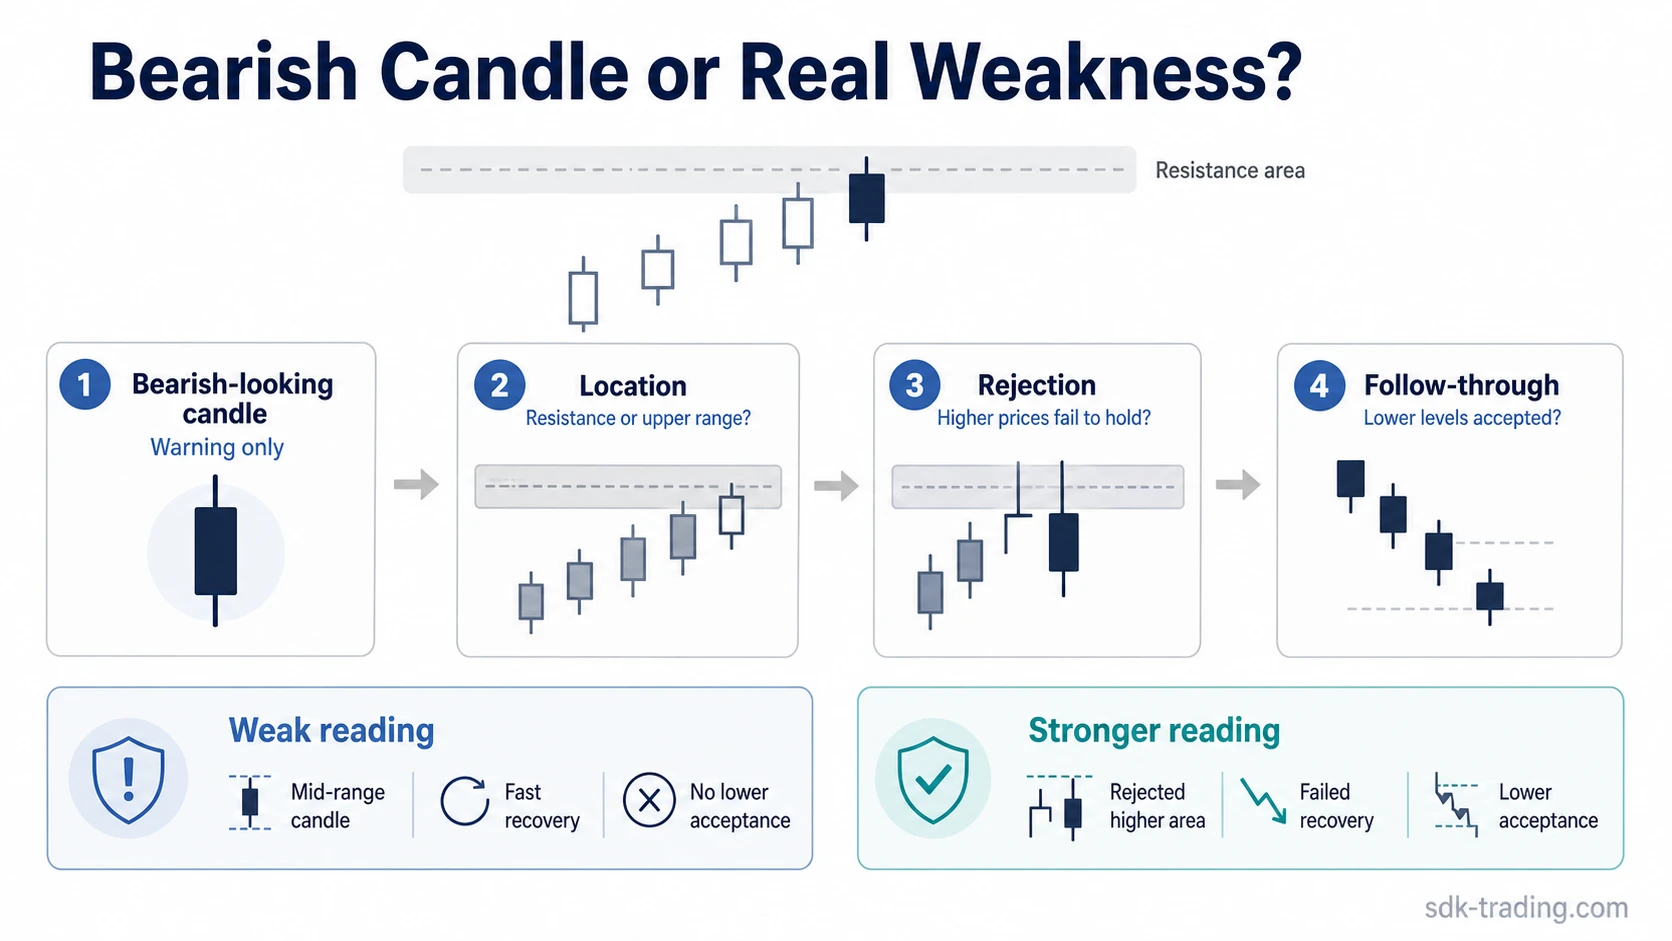
- Bearish candlestick patterns are best read as evidence of possible weakness, not as automatic reversal proof.
- The strongest bearish readings usually combine location, rejection, weak recovery, and lower acceptance.
- Different bearish patterns test different conditions: rejection, compression, continuation, exhaustion, or failed recovery.
- Small-body candles and long-wick candles often show hesitation first; direction depends on the next response.
- Use the pattern family to classify the reading, then move into the deeper pattern page for the specific structure.
What Bearish Candlestick Patterns Mean
Bearish candlestick patterns are chart formations that suggest selling pressure, failed buying effort, or weakening upside continuation. They usually matter most after an advance, near resistance, after a failed breakout attempt, or when a market cannot hold higher prices.
The word bearish describes the pressure implied by the candle structure. It does not prove that a full reversal has started. A red body, a long upper wick, or a two-candle reversal label can still fail if price holds above the prior area and demand returns quickly.
A stronger bearish reading usually has a sequence: price tests higher, struggles to continue, closes poorly or rejects the upper area, then fails to recover that area on the next response. Without that sequence, many bearish-looking candles remain warnings rather than confirmed evidence.
How to Read Bearish Candlestick Patterns
The safest way to read a bearish candle is to separate structure from label. The candle may show pressure, but the surrounding chart decides whether that pressure is useful.
| Reading factor | Stronger bearish evidence | Weaker or unresolved evidence |
|---|---|---|
| Location | The pattern forms after an advance, near resistance, near a prior swing high, or after a failed breakout. | The pattern forms in the middle of a range with no clear tested area. |
| Candle close | The candle closes away from the tested high, below the prior body area, or near the lower part of its range. | The candle looks bearish but closes where buyers still retain meaningful control. |
| Wick and body relationship | The wick or body shows a clear rejection, failed continuation, or decisive shift in control. | The candle has mixed shadows, a small body, or unclear placement that mainly shows hesitation. |
| Follow-through | Later candles fail to reclaim the rejected area or begin holding lower levels. | Price quickly reclaims the rejected area and accepts above it. |
| Pattern family | The candle family matches the market condition: rejection, compression, continuation, or failed recovery. | The label is forced onto a structure that does not match the surrounding behavior. |
| Invalidation | The bearish reading can be weakened or abandoned if price accepts higher again. | The pattern name is treated as stronger than the actual market response. |
Bearish Candlestick Pattern Classification Map
Different bearish patterns warn about different conditions. Some show direct rejection. Some show compression after an advance. Some show continuation pressure. Others look bearish at first but remain ambiguous until the next candles respond.
| Pattern family | What it usually tests | What can make it stronger | Related structure |
|---|---|---|---|
| Rejection patterns | Whether higher prices were tested and rejected. | A weak close, failed recovery, and later candles staying below the rejected area. | Bearish engulfing behavior gives a clearer example of two-candle rejection after prior upside pressure. |
| Compression patterns | Whether upside momentum is stalling after an advance. | A narrow second candle, lower follow-through, or failure to regain the prior body area. | Bearish harami context fits when the issue is hesitation after a larger bullish candle. |
| Continuation patterns | Whether sellers can hold control after a pause. | Lower acceptance after the pause instead of a quick reclaim into the prior range. | Bearish continuation structures fit when the issue is downside follow-through, not reversal from strength. |
| Indecision patterns | Whether momentum has slowed without direction being settled. | A following candle that rejects recovery or expands lower after the indecision candle. | A doji-style pause needs context before it becomes part of a bearish reading. |
| Ambiguous recovery shapes | Whether a long lower shadow is recovery, rejection, or unresolved pressure. | Failure to hold the recovery attempt on the next response. | A hammer-shaped candle should not be forced into a bearish reading without follow-up evidence. |
| Dramatic multi-candle labels | Whether a strong visual pattern also has structural support. | Location, failed recovery, and downside acceptance after the full sequence completes. | Bearish three-line strike context needs the same evidence checks as simpler patterns. |
Common Bearish Candlestick Patterns
The most common bearish candlestick patterns can be grouped by the type of weakness they try to show. This keeps the reading focused on structure instead of memorizing every candle name as if each one carried the same weight.
Bearish Engulfing:
A bearish engulfing pattern shows a larger bearish candle overwhelming the prior bullish body. It is most meaningful after an advance or failed breakout, especially when the next response cannot reclaim the engulfed area.
Bearish Harami:
A bearish harami shows compression after a larger bullish candle. It does not prove that sellers have taken control. It first shows that the prior buying drive has paused, and the next response decides whether the pause becomes weakness.
Shooting Star and Upper-Wick Rejection:
A shooting-star type candle shows that price traded higher but closed away from the high. The long upper wick matters more when it forms near resistance and later candles fail to accept back into the rejected area.
Dark Cloud Cover:
Dark cloud cover shows a bullish candle followed by a bearish response that closes deeply into the prior candle body. The reading is stronger when the second candle changes the prior session’s control rather than only producing a temporary pullback.
Evening Star:
An evening star is a three-candle structure where a strong bullish candle is followed by a smaller pause candle and then a bearish candle. The pause matters because it shows momentum slowing before the bearish response appears.
Three Black Crows:
Three black crows and similar multi-candle sequences show repeated downside closes. The risk is chasing the label after the move is already extended. The better reading checks whether the sequence begins from a meaningful failed area and whether downside acceptance remains intact.
Why Bearish Candles Are Often Misread
The most common mistake is treating a bearish formation as a completed reversal before the chart has rejected higher prices. A candle can look negative because of profit-taking, temporary hesitation, thin participation, or a pause inside a broader range.
Mid-range candles are especially easy to overread. If price is not near a meaningful resistance area, prior swing high, failed breakout, or upper range boundary, the pattern may show only short-term friction. The same candle becomes more important when it appears after a clear advance and the next response cannot recover lost ground.
Small-bodied candles create a different problem. A small indecision candle can warn that momentum is slowing, but it does not define direction by itself. The next candles decide whether hesitation becomes rejection, continuation, or simple consolidation.
Simple Bearish Candlestick Reading Example
Price advances into a prior resistance area and briefly trades above it. A candle then closes weak with a long upper wick. That candle does not confirm a reversal by itself. It only shows that higher prices were tested and not accepted cleanly.
The bearish reading strengthens if the next recovery attempt stalls below the rejected area and later candles begin holding lower. It weakens if buyers reclaim the rejected area and keep price above it. If price only moves sideways, the pattern remains unresolved rather than confirmed.
The useful lesson is sequence. A bearish candle can start the warning, but location, failed recovery, and follow-through decide whether the warning has weight.
How to Use Bearish Patterns Safely
A bearish candlestick pattern should be treated as one part of a reading process. The candle may show pressure, but the broader structure determines whether that pressure has enough context to matter.
Start with the tested area. Then check the candle relationship. Then check whether later candles accept lower levels or recover the rejected area. If those parts do not align, the pattern remains a weak clue rather than a defensible bearish reading.
The goal is not to memorize every bearish name. The goal is to separate rejection, compression, continuation, and ambiguity before the pattern becomes part of a trading interpretation.
FAQ
Are bearish candlestick patterns reliable?
They are more reliable as contextual evidence than as standalone reversal proof. Location, rejection, failed recovery, and follow-through matter more than the pattern name alone.
What makes a bearish candlestick pattern stronger?
A bearish pattern becomes stronger when it appears after an advance, near resistance, and is followed by failed recovery or lower acceptance. The pattern name matters less than the surrounding evidence.
Can a bearish candle fail?
Yes. A bearish candle can fail when buyers quickly reclaim the rejected area, hold higher prices, or prevent downside follow-through.
Is a doji bearish?
A doji can become part of a bearish reading when it appears after an advance and later price action confirms rejection. By itself, it often shows hesitation rather than direction.