Bullish candlestick patterns are candlestick structures that can mark failed lower acceptance, downside rejection, or a shift from selling pressure toward demand. The bullish reading stays conditional until the tested area holds and later price response supports the change in pressure.
The useful way to read them is by structure first. A single candle gives an early warning. A double-candle pattern shows a relationship between the prior candle and the response candle. A triple-candle pattern depends on sequence. A continuation pattern belongs inside an existing upward attempt rather than after a completed decline.
Bullish Candlestick Patterns, Defined
Bullish candlestick patterns are single-candle or multi-candle formations that can show failed lower-price acceptance, reduced selling pressure, renewed demand, or continuation after a pause. They are not complete signals by name alone. The reading becomes stronger only when the pattern appears in the right context and later candles confirm that buyers are accepting higher prices.
Key Points
- Bullish candlestick patterns should be grouped by structure: single, double, triple, and continuation.
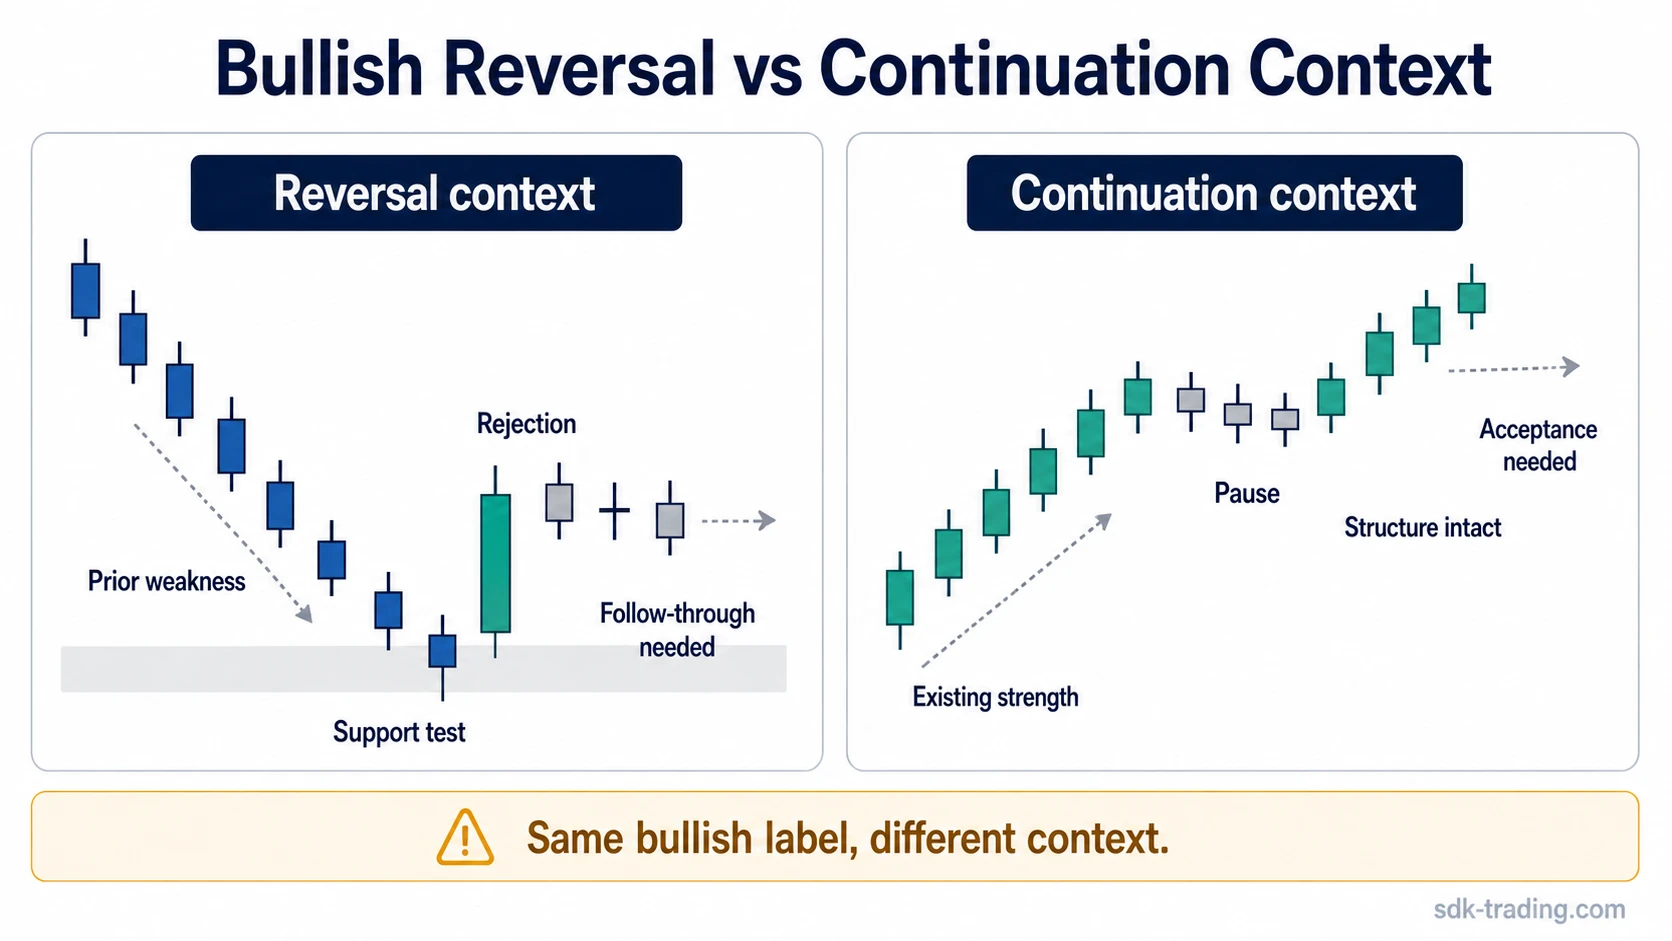
- A bullish reversal pattern needs prior weakness or a tested lower area before the reversal idea makes sense.
- A bullish continuation pattern needs an existing upward structure and a pause that does not break that structure.
- The pattern name is only the first classification. Location, rejection, follow-through, and acceptance decide whether the reading improves, weakens, or fails.
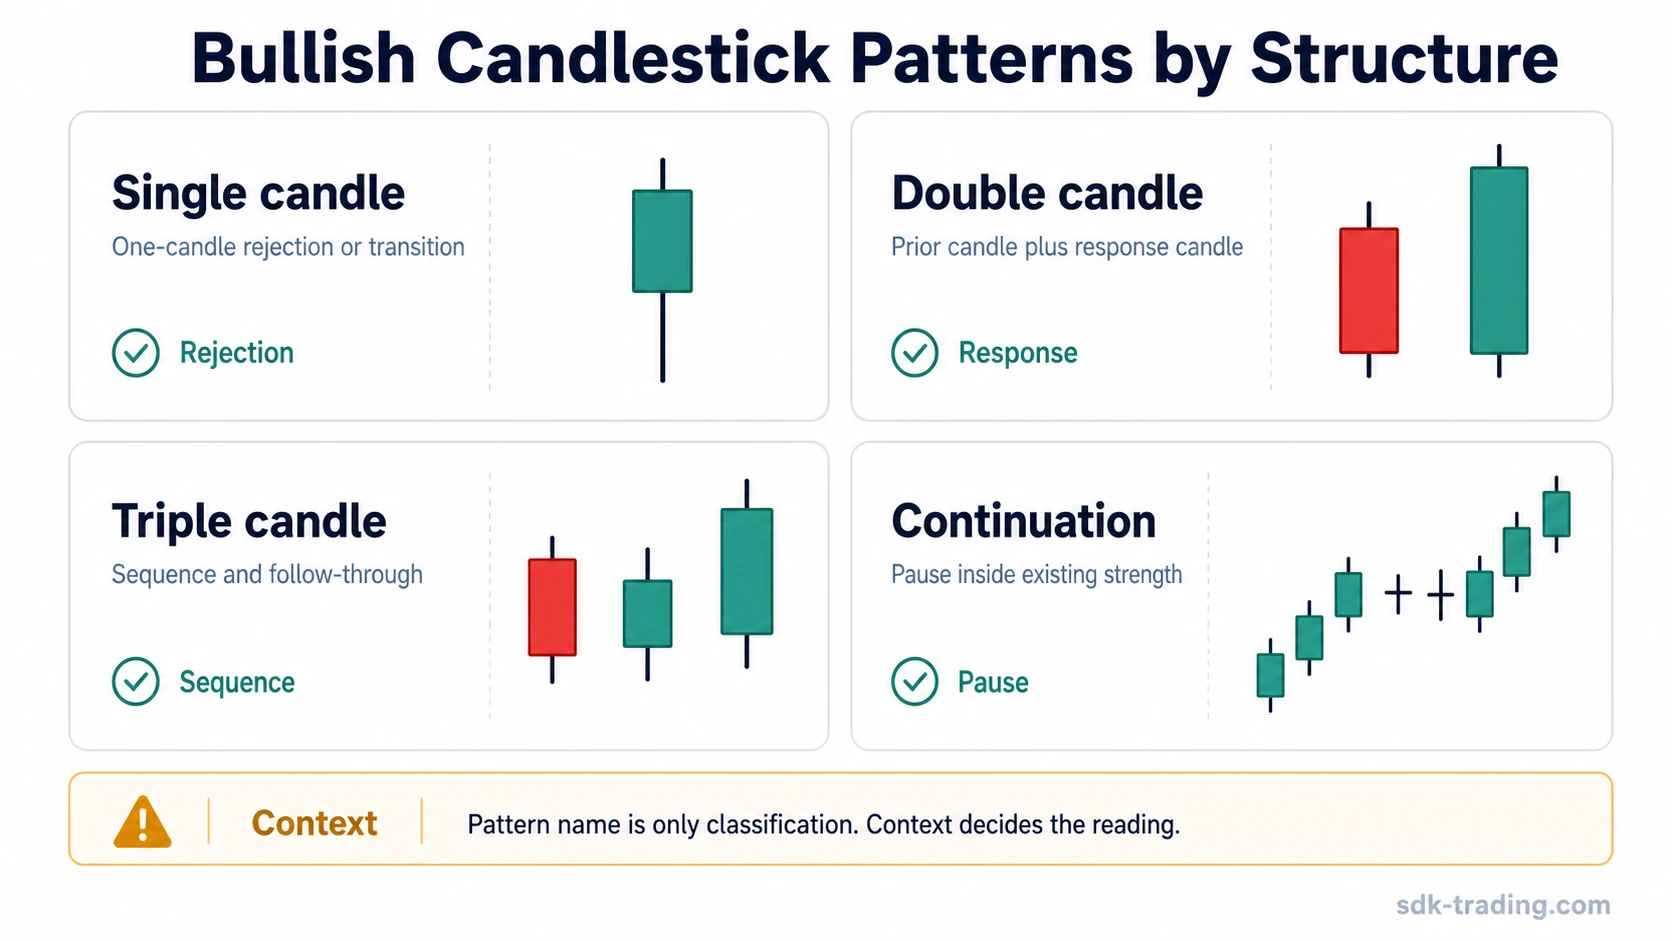
Bullish Candlestick Patterns by Structure
Structure changes what a bullish pattern can reasonably suggest. A one-candle rejection has less evidence than a two-candle response. A sequence of three candles carries a different message from a continuation pattern that appears while buyers already have control.
| Structure group | What it helps separate | Example patterns | Best next concept |
|---|---|---|---|
| Single candle | One-candle rejection, indecision, or lower-price failure after selling pressure. | Hammer, inverted hammer, dragonfly doji, doji | Start with a lower-rejection candle such as the hammer. Then compare it with a doji transition context. |
| Double candle | A relationship between the prior candle and the response candle. | Bullish engulfing, bullish harami, piercing line | Use a two-candle reversal structure like bullish engulfing. Compare it with a smaller pause-and-response structure like bullish harami. |
| Triple candle | A multi-candle sequence where order, spacing, and follow-through shape the reading. | Morning star, three white soldiers, bullish three line strike | Review a multi-candle bullish three line strike structure as a sequence-dependent reading. |
| Continuation | A bullish pause inside an existing upward structure rather than a reversal attempt after a decline. | Bullish separating lines, rising three methods | Use a bullish continuation structure such as separating lines to separate continuation logic from reversal logic. |
How to Identify a Stronger Bullish Reading
A stronger bullish reading usually starts with a tested area, not with the candle label. The pattern needs a reason to matter: prior selling pressure, a lower-range test, a failed push below support, or a pause inside an existing upward move.
| Reading filter | Stronger bullish reading | Weaker reading | Failed or invalid reading |
|---|---|---|---|
| Location | The pattern forms near a meaningful tested area or after enough prior selling pressure. | The pattern forms in the middle of a noisy range with no clear test. | The pattern forms where the surrounding structure does not support a bullish interpretation. |
| Candle relationship | The response candle or sequence shows that sellers lost control of the tested area. | The candle is bullish in color, but the relationship to the prior candle is unclear. | The next candle immediately erases the body or closes back into the rejected area. |
| Rejection | Lower prices are tested and rejected, leaving evidence that acceptance failed below the area. | Price pauses but does not clearly reject the lower area. | Price returns to the lower area and accepts there after the pattern appears. |
| Follow-through | Later candles hold above the tested area and begin accepting higher prices. | Later candles stay inside the pattern range without resolving the reading. | Later candles break the structure that made the pattern look bullish. |
Single-Candle Bullish Patterns
Single-candle bullish patterns compress the first warning into one candle. They can show rejection, indecision, or a failed attempt to keep price lower, but they carry less structural evidence than multi-candle patterns because the response has not yet developed across a sequence.
A hammer is usually read through lower rejection after price has already moved down or tested a lower area. A doji is weaker as a bullish label because it mainly shows indecision or transition. It may support a bullish reading only when the surrounding structure shows that sellers failed to maintain control.
Double-Candle Bullish Patterns
Double-candle bullish patterns add a second piece of information: how price responds after the first candle. That relationship can matter more than the label itself because the second candle shows whether buyers changed the short-term result.
A bullish engulfing structure usually depends on a strong response candle that overtakes the prior bearish candle. A bullish harami is more compressed. It often reflects a pause or reduced selling range before the market proves whether demand is actually returning. Both structures still need later acceptance rather than a label-only reading.
Triple-Candle Bullish Patterns
Triple-candle bullish patterns depend on order. The individual candles matter, but the sequence matters more: what came first, how the middle candle changed the rhythm, and whether the final candle confirms or weakens the possible bullish shift.
The bullish three line strike is a useful example because the interpretation is not based on one candle in isolation. It depends on how the sequence forms and whether later candles accept higher prices instead of immediately giving the structure back.
Bullish Continuation Patterns
Bullish continuation patterns should be separated from bullish reversal patterns. A reversal structure tries to read a possible shift after weakness. A continuation structure usually appears after strength and asks whether the pause is being absorbed without breaking the broader upward attempt.
Bullish separating lines belong in that continuation family. The key question is not whether the candle looks bullish in isolation. The question is whether the existing upward structure remains intact and whether the next candles continue accepting higher prices.
How to Read the List Without Overreading It
A bullish-looking candle can be tempting after a decline, but the label alone is incomplete. The same shape can carry different meaning depending on where it appears, whether the prior move was exhausted or still controlled, and whether lower prices were rejected or accepted.
| Check | Useful question | Why it matters |
|---|---|---|
| Location | Did the pattern form near a meaningful support area, prior reaction zone, or lower-range test? | A bullish candle in the middle of noise carries less information than a bullish response at a tested area. |
| Prior move | Was there enough selling pressure before the pattern for a reversal reading to make sense? | Some bullish patterns need prior weakness; others belong inside continuation structure. |
| Rejection | Did price fail to hold lower levels, or did it simply pause? | Failed lower acceptance is stronger than a candle that only closes slightly higher. |
| Follow-through | Do later candles hold above the tested area or immediately give it back? | Follow-through separates early warning from a stronger bullish reading. |
| Acceptance | Are buyers accepting higher prices after the pattern? | A bullish structure weakens if price cannot hold above the area that made the candle look important. |
Bullish Candlestick Pattern Example in Context
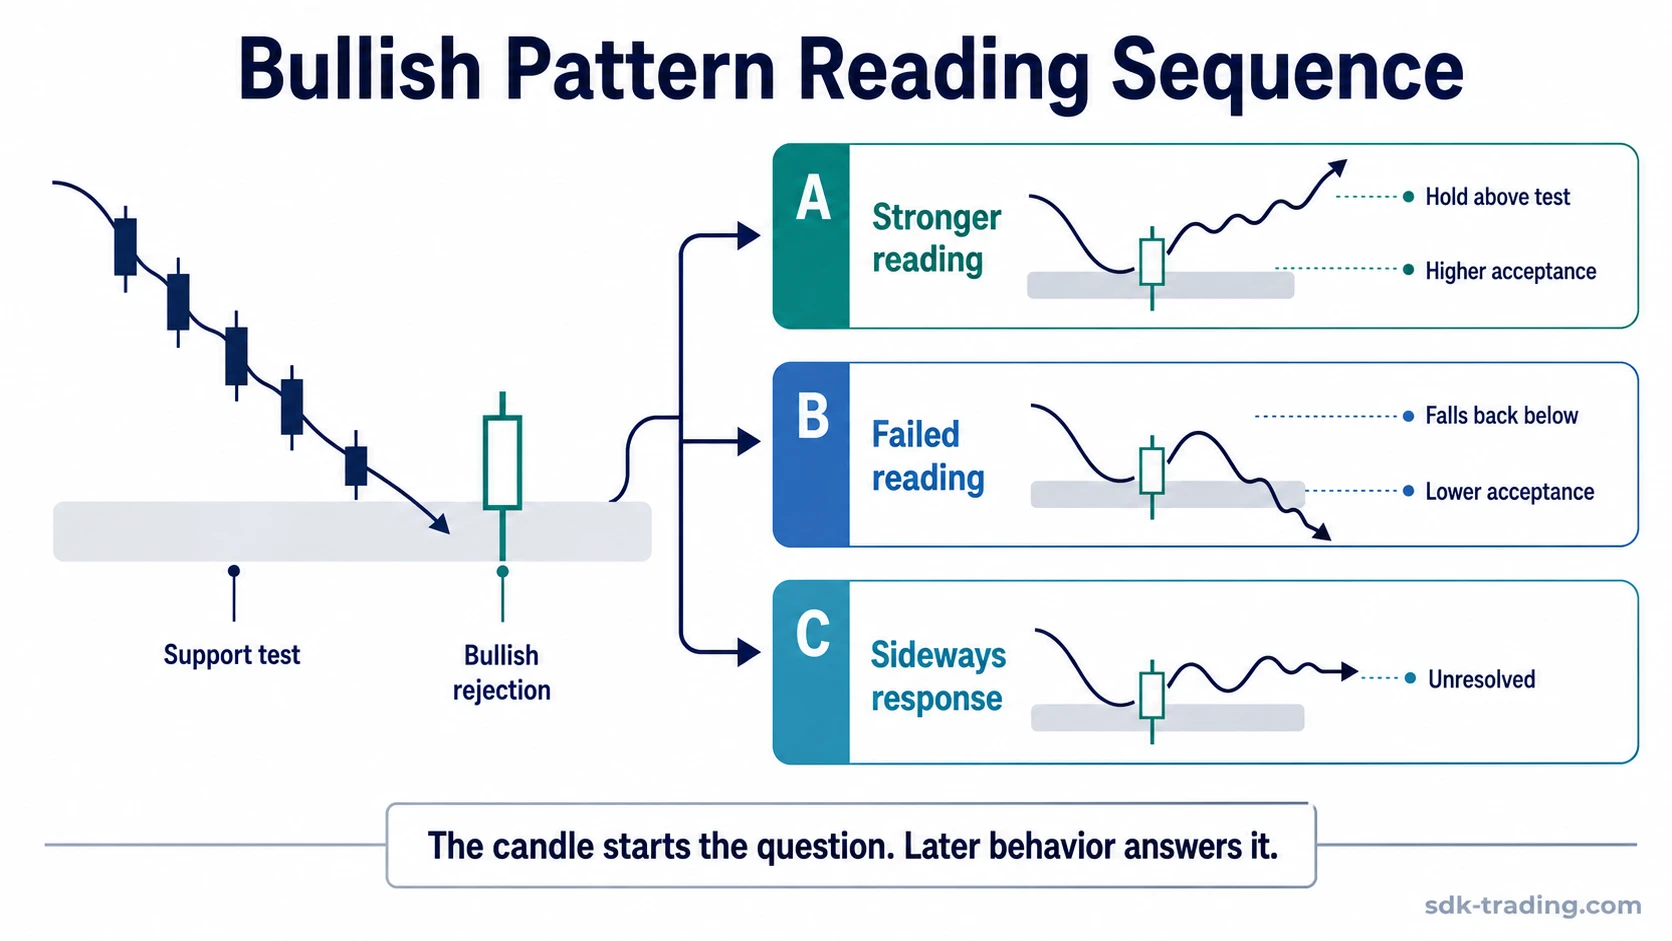
Price declines into a prior reaction area, trades briefly below it, and then closes back above the tested zone with a lower wick. The candle is an early bullish warning because sellers failed to keep price lower, but the warning is not complete by itself.
The reading improves if the next candles hold above the tested area and buyers begin accepting higher prices. It weakens if price quickly falls back below the area and lower prices become accepted. If price moves sideways without clear acceptance in either direction, the pattern remains unresolved rather than confirmed.
Common Mistake: Treating the Pattern Name as the Signal
The pattern name is only a classification. A bullish engulfing, hammer, harami, or continuation candle can describe shape, but shape does not prove demand by itself. The stronger reading comes from the relationship between shape, location, prior pressure, rejection, and later acceptance.
Bullish candlestick patterns work better as a sorting system than as a fixed decision rule. The structure tells you what kind of evidence to inspect next. The following candles decide whether that evidence improves, fails, or stays unresolved.
FAQ
What are bullish candlestick patterns?
Bullish candlestick patterns are candle structures that can show weakening selling pressure, returning demand, or continuation after a pause. They need context and follow-through before the reading becomes stronger.
Which bullish candlestick pattern is the strongest?
No bullish pattern is strongest in every market. A pattern becomes more useful when it forms at a meaningful location, shows clear rejection or response, and later candles accept higher prices.
When is a bullish pattern reversal rather than continuation?
A bullish reversal reading needs prior weakness, a lower-area test, or failed selling pressure. A bullish continuation reading needs an existing upward structure and a pause that does not lose acceptance.
Can a bullish candlestick pattern fail?
Yes. A bullish reading weakens or fails when price returns to the tested lower area, accepts below the pattern, or cannot hold the area that made the candle look important.