A chart patterns cheat sheet is a trading chart-pattern reference for classifying common price structures before checking the matching structure in more detail.
It does not decide entry timing, stop placement, targets, win rate, profit potential, or trade quality. A pattern name is only a starting label until the surrounding structure, boundary behavior, and follow-through are checked.
Use the cheat sheet by first identifying the broad family, then checking the most relevant structural cue, then checking the matching pattern structure before forming an interpretation.
Key Points
- A cheat sheet helps classify broad chart-pattern families, not predict the next price move.
- Shape resemblance is weaker than a structure with repeated reactions, visible boundaries, and later behavior around those boundaries.
- Continuation, reversal, wedge, top, and bottom structures require different follow-up checks.
- A clean label should lead to a more specific structural check before the pattern is interpreted.
- The chart-pattern label should not be treated as a standalone trading signal.
What a Chart Patterns Cheat Sheet Is For
A trading chart-pattern reference is useful when the first problem is classification. A trader may see a compression, a rounded turn, a repeated top, or a sharp reversal shape, but the first visual label can be too loose if it is not checked against structure.
The safer use is narrow: identify the likely family, compare the shape with the conditions that define that family, and then move from broad recognition to a more precise structural check. A chart pattern is stronger as a study object when its boundaries existed before the label was applied, not after lines were adjusted to fit the shape.
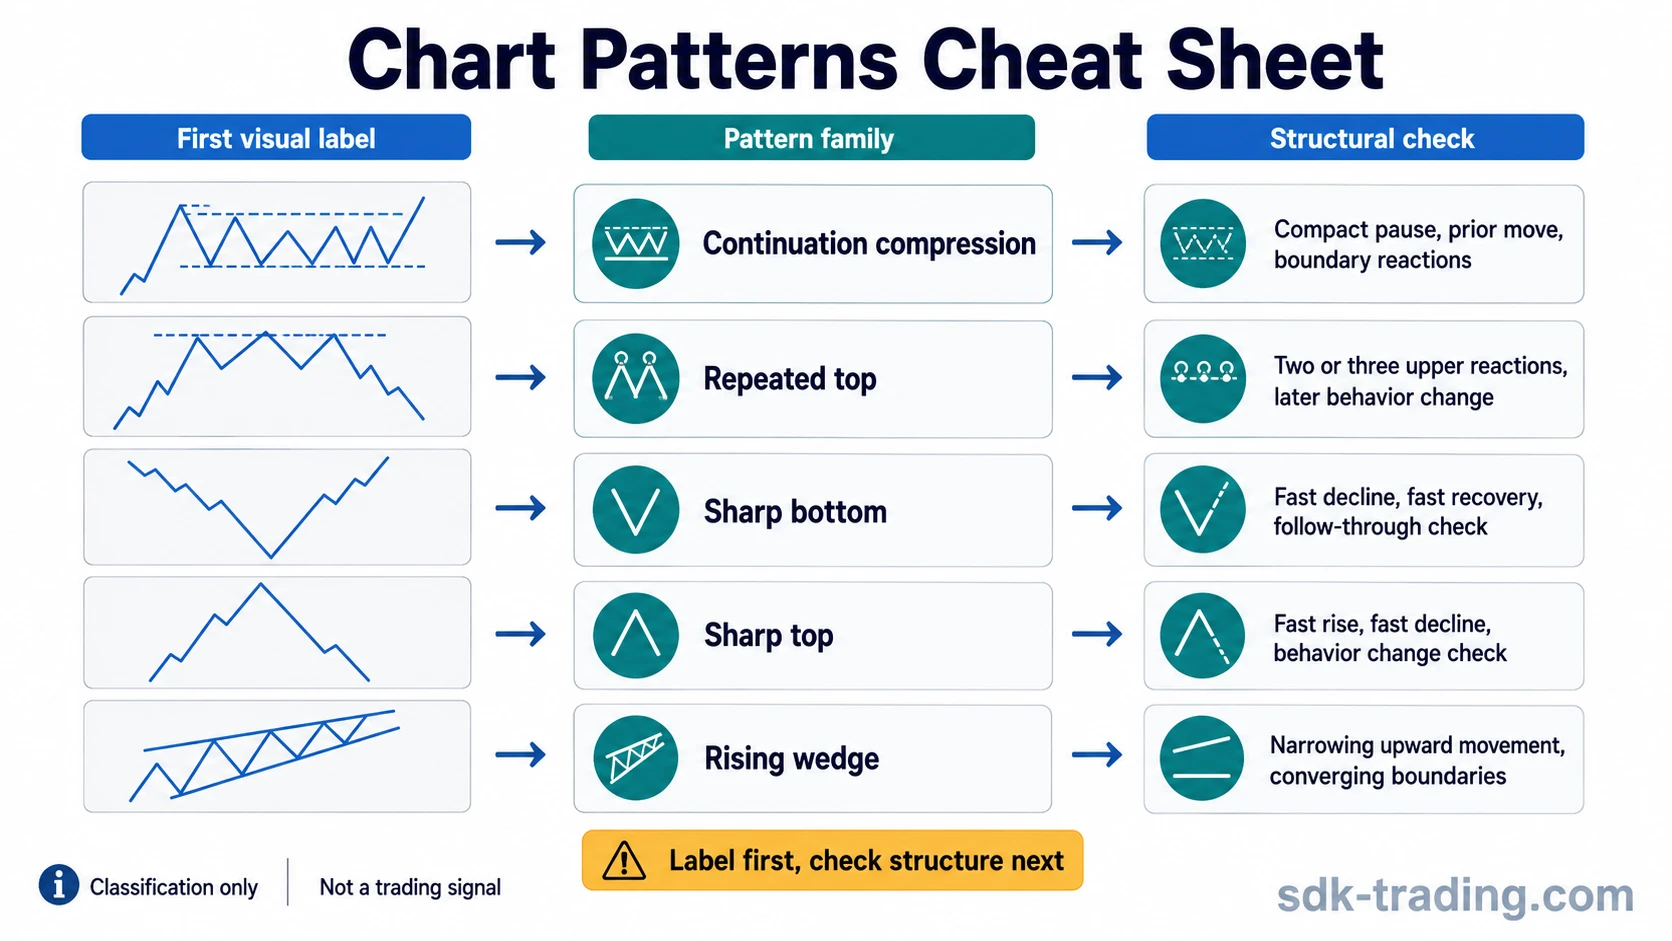
Chart Pattern Categories at a Glance
The table below groups common chart-pattern families by what needs to be inspected next. The aim is classification, not trade selection.
| Pattern family | What to inspect next | Common visual clue | Next structural check |
|---|---|---|---|
| Continuation compression | Whether the pause forms after a prior directional move and keeps a compact boundary structure. | A small, narrowing pause after expansion. | Compact continuation structure |
| Repeated top structure | Whether price reacts near a similar upper area more than once and then changes behavior afterward. | Two clear upper reactions. | Two-reaction top structure |
| Extended repeated top | Whether a third reaction adds evidence of repeated rejection or only creates a noisy range. | Three upper attempts near a similar area. | Three-reaction top structure |
| Sharp bottom reversal shape | Whether the turn is only a fast bounce or a more complete bottoming structure. | A steep decline followed by a steep recovery. | Sharp bottom reversal structure |
| Sharp top reversal shape | Whether a fast upside move reverses with enough behavior change to justify a top label. | A steep rise followed by a steep decline. | Sharp top reversal structure |
| Rising wedge structure | Whether price is narrowing upward between converging boundaries rather than simply trending higher. | Higher highs and higher lows that compress. | Narrowing rising structure |
How to Use a Chart Pattern Cheat Sheet Without Treating It as a Signal
Start with the broad structure. A compact pause after a prior move belongs in a different family from a repeated top or a sharp V-shaped turn. The first label should be treated as a working classification, not a conclusion.
| Step | Question to ask | Why it matters |
|---|---|---|
| 1. Classify the family | Is the structure a compression, a top, a bottom, a wedge, or a broader range? | Different families use different boundary and follow-through checks. |
| 2. Check the boundary | Were the relevant boundaries visible before the label was applied? | Adjusted lines can make weak resemblance look more structured than it is. |
| 3. Count reactions carefully | Are there repeated reactions, or only one visual touch that has been overinterpreted? | Many pattern labels depend on repeated behavior, not one isolated point. |
| 4. Separate resemblance from structure | Does price behavior support the label, or does the chart only look familiar? | Visual similarity alone can create false confidence. |
| 5. Check the specific pattern | Which pattern best matches the structure? | The specific structural check gives the correct boundary conditions and limitations for that pattern family. |
Pattern Resemblance vs Structure
A familiar-looking outline is not the same as a defensible chart-pattern classification. A pattern becomes easier to classify when the structure has visible boundaries, repeated reactions, and behavior that can be compared before and after the suspected pattern area.
A light orientation example is enough. A compact triangle-like pause after a strong move may lead toward a continuation-pattern check, while a sharp selloff and recovery may belong to a bottoming-structure check. The useful step is not to trade the first label, but to match the observed behavior with the correct structural family.
Common misread:
The most common mistake is drawing lines after the fact until a chart resembles a known pattern. That produces a label, but it does not prove that the market accepted the structure, respected the boundary, or changed behavior in a way that supports the label.
Common Follow-Up Checks
Use the first visual label as a starting point for the next structural check. Repeated top structures, sharp reversal structures, compact continuation pauses, and wedge structures each need their own boundary logic.
| If the chart first looks like… | Check first | Interpretation boundary |
|---|---|---|
| A compact continuation pause | Prior move, compression quality, and boundary reactions. | The structure should not be reduced to a triangle-like drawing alone. |
| A double or triple top | Number of reactions, spacing between attempts, and behavior after the final attempt. | A repeated high area is not enough if later behavior does not show a clear behavior change. |
| A V-shaped top or bottom | Speed of the turn, follow-through, and whether the reversal shape has enough structure. | A fast move can be a reaction rather than a complete pattern. |
| A rising wedge | Converging boundaries, narrowing movement, and whether the structure compresses as it rises. | A rising trend alone is not a wedge if it does not narrow. |
What the Cheat Sheet Does Not Decide
A chart patterns cheat sheet does not decide whether a setup is worth taking. It does not define entry timing, exit timing, targets, stop placement, position size, expected win rate, profit potential, or the quality of a trade idea.
It also does not replace chart pattern identification. A cheat sheet can name the family, but the more important work is checking whether the structure existed before the label, whether price respected the relevant boundaries, and whether later behavior supported or weakened the classification.
Boundary of use:
The safest role for a cheat sheet is classification. Interpretation requires a separate check of context, boundary behavior, follow-through, and invalidation. Without those checks, the pattern name can become a shortcut for certainty that the chart has not earned.
FAQ
Why do similar-looking chart patterns fail?
Similar-looking patterns often fail because the shape is only resemblance. The structure may lack repeated reactions, accepted boundaries, or follow-through behavior that supports the label.
Should a cheat sheet include every chart pattern?
Not necessarily. A useful cheat sheet should help separate major pattern families and point toward the right structural checks. A very large pattern list can become harder to use if it encourages memorization instead of analysis.
What is the difference between a cheat sheet and chart pattern identification?
A cheat sheet is a quick reference for broad classification. Chart pattern identification is the more detailed process of checking boundaries, reactions, context, and whether the label is structurally defensible.