Chart patterns for crypto are recurring price structures that traders use to organize possible continuation, reversal, or consolidation scenarios on cryptocurrency charts. The label alone is not enough. Crypto markets trade continuously, can move through sharp volatility bursts, and often show wick-heavy behavior across fragmented venues, so a familiar-looking pattern needs to be checked against structure, liquidity, and later acceptance.
A crypto chart pattern is best treated as a reading framework, not as a forecast. A triangle, wedge, top, bottom, or V-shaped move can describe how price is behaving, but the interpretation remains conditional until later behavior either supports the structure or rejects it. The useful question is not only “what pattern does this look like?” but also “is the market still behaving in a way that supports that label?”
Key Points
- Crypto chart patterns use familiar visual structures, but continuous trading and volatility can change how those structures should be read.
- Sharp wicks and brief boundary moves can create false visual labels before a structure is actually accepted.
- Pattern families are more useful than isolated names when the goal is to decide what kind of structure needs review.
- Liquidity, token size, exchange fragmentation, and timeframe can change the quality of the same visual pattern.
- A specific pattern name becomes more useful after the broad structure has been identified.
What Chart Patterns for Crypto Mean
Chart patterns for crypto describe repeated structures that appear when price compresses, rotates, rejects an area, accelerates sharply, or forms a recognizable sequence of swings. These structures can help organize a chart into broad families such as continuation patterns, reversal patterns, consolidation patterns, and wedge-like narrowing structures.
The same pattern name can appear across stocks, forex, futures, and crypto, but crypto adds extra interpretation problems. A structure may form without a regular market open or close. A move may extend through a boundary during a liquidation burst and then return quickly. A smaller token may print a cleaner-looking shape simply because the market is thinner, not because the structure is more meaningful.
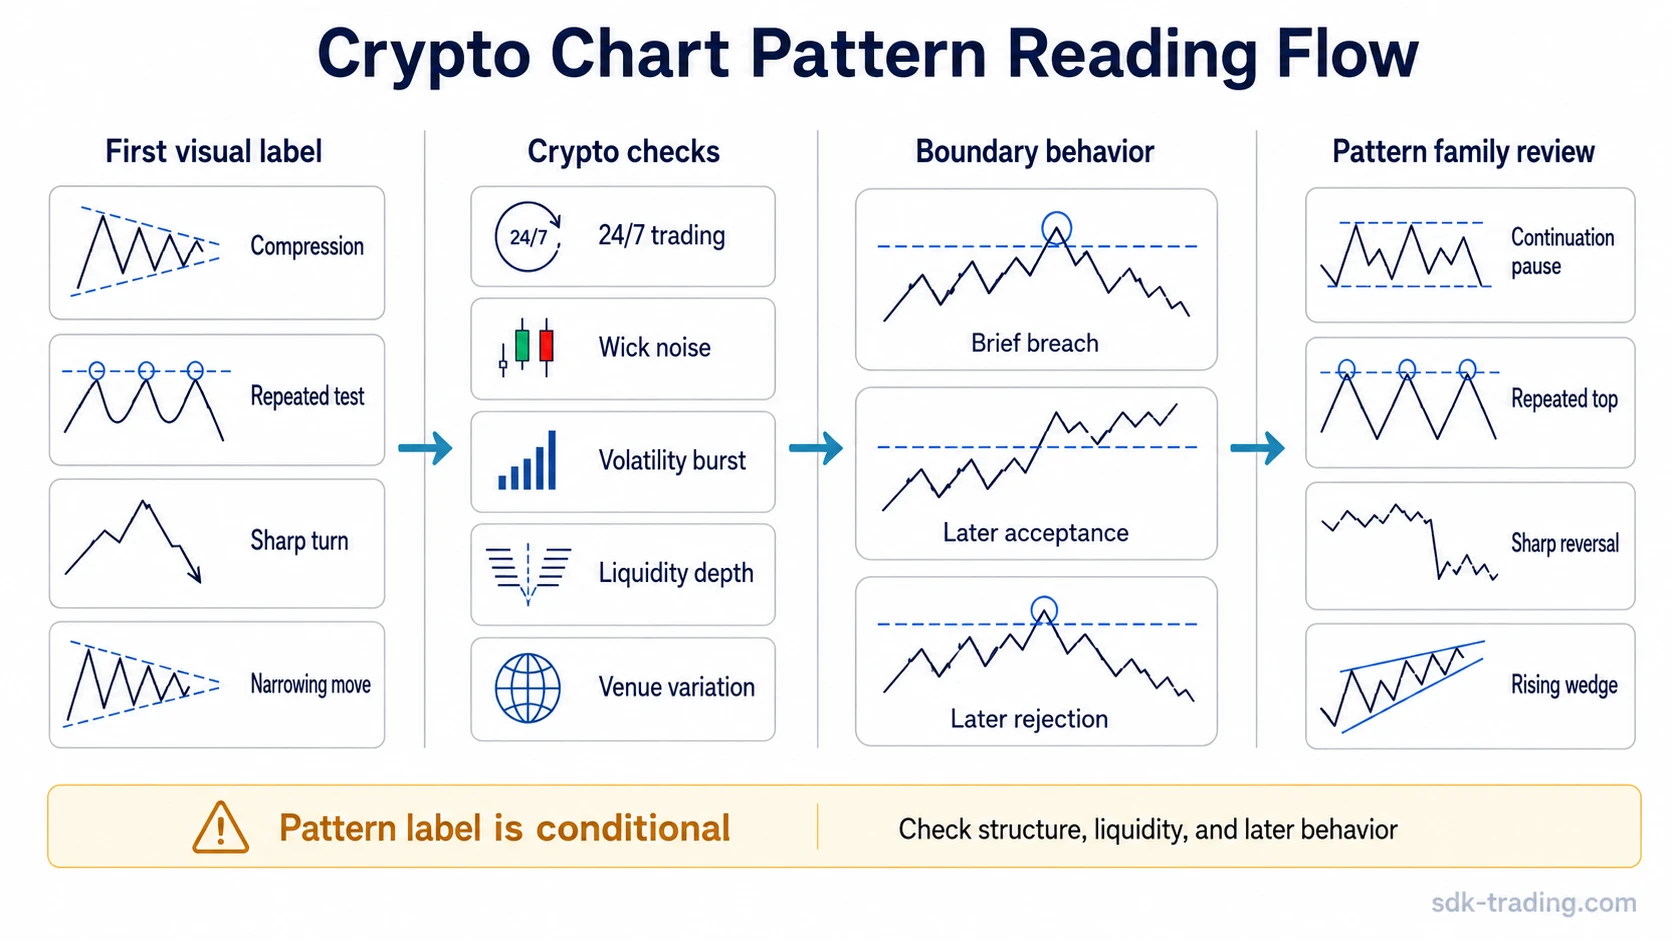
For that reason, crypto chart patterns should be read in layers. First comes the visual label. Then comes the structural check: where the swings are forming, whether the boundary is being respected or rejected, and whether later behavior supports the initial reading. The pattern name is only a shortcut for the structure, not a complete interpretation by itself.
Why Crypto Market Structure Changes Pattern Reading
Crypto markets do not have the same rhythm as regular-session stock markets. Trading can continue through weekends, regional liquidity windows, and sudden news-driven bursts. That continuous structure can make chart patterns look more stretched, more wick-heavy, or less orderly than textbook examples.
| Crypto condition | Why it affects pattern reading | Safer interpretation |
|---|---|---|
| 24/7 trading | There is no single regular session that cleanly resets participation every day. | Read the structure across the selected timeframe instead of assuming stock-session behavior. |
| Volatility bursts | Fast moves can push through a visible boundary before the market accepts the new area. | Separate a brief breach from later behavior that remains outside the prior structure. |
| Wick noise | Sharp wicks can make a pattern look completed before follow-through appears. | Treat the first wick as information, not as confirmation by itself. |
| Exchange fragmentation | The same token can show slightly different behavior across venues and liquidity pools. | Be careful when a pattern depends on one thin or distorted print. |
| Major coins vs smaller tokens | Large-cap crypto assets usually have deeper participation than thin tokens. | Expect smaller tokens to produce more visual noise and less stable pattern boundaries. |
This changes the reading: a clean-looking crypto pattern can still be weak if it depends on a thin move, a single wick, or a boundary that later fails to hold. A messy-looking structure can also become more useful if later behavior repeatedly respects the same area and shows clearer acceptance.
Crypto Chart Pattern Families and Where to Look Next
Start with the chart problem before choosing a pattern name. Is price compressing? Is a top being tested repeatedly? Is the move sharply reversing? Is the structure narrowing upward? Each problem points toward a smaller pattern family that can be reviewed in more detail.
| Chart problem | What the structure suggests reviewing | Pattern family to study |
|---|---|---|
| Price compresses after a strong move and the swings become smaller. | The question is whether the chart is forming a continuation-style pause or only noisy sideways movement. | Review compact continuation structures such as a tight post-move consolidation pattern. |
| Price tests a high area, rejects it, and returns toward the prior structure. | The question is whether the second failure near the same area changes the reversal reading. | Review repeated rejection structures such as a two-test top formation. |
| Price tests a top area multiple times and still cannot maintain behavior beyond it. | The question is whether repeated failure adds structural weight or only creates a crowded visual label. | Review multi-test reversal structures such as a three-test top pattern. |
| Price falls sharply, turns quickly, and forms a steep upside recovery. | The question is whether the move is a true structural reversal or only a fast volatility response. | Review sharp bottoming structures such as a fast downside-to-upside reversal pattern. |
| Price rises sharply, turns quickly, and gives back the prior move. | The question is whether the reversal is accepted or whether the chart is only reacting to short-term volatility. | Review sharp topping structures such as a fast upside-to-downside reversal pattern. |
| Price keeps climbing while the structure narrows and reactions become less expansive. | The question is whether the narrowing structure is still supported by behavior or beginning to weaken. | Review upward narrowing structures such as a rising narrowing pattern. |
This family-first approach keeps the broad crypto question separate from the specific pattern question. The broad question identifies the kind of structure. The specific pattern review decides whether the label is actually defensible.
Recognition, Completion, and Acceptance
A common mistake in crypto chart-pattern reading is treating recognition as completion. Recognition means the chart resembles a known pattern family. Completion means the structure has reached the condition that makes the label more defensible. Acceptance means later behavior continues to support the new area or structural reading instead of immediately returning inside the prior range.
| Stage | Meaning | Crypto-specific caution |
|---|---|---|
| Recognition | The chart visually resembles a known pattern family. | Crypto charts can create familiar shapes from wick noise or thin liquidity. |
| Completion | The structure reaches the condition that makes the pattern label more reasonable. | A single boundary breach can be misleading if it is immediately rejected. |
| Acceptance | Later behavior continues to support the structural reading. | The reading weakens if price quickly returns inside the prior structure. |
| Failure | The market rejects the pattern reading and behaves against the expected structure. | Failure can appear quickly during volatility bursts, especially on thin tokens. |
Illustrative scenario: A crypto pair briefly pushes beyond a visible pattern boundary during a fast volatility burst, then returns inside the prior range. The useful distinction is not the first wick through the boundary. The useful distinction is whether later behavior continues to accept the new area or rejects it by moving back into the old structure.
Common Misreads in Crypto Chart Patterns
Many crypto chart-pattern mistakes come from reading the label faster than the structure. A familiar shape can be useful, but the chart still needs context. Liquidity, timeframe, token size, and later behavior can all change the reading.
| Common misread | Why it happens | Better check |
|---|---|---|
| A wick beyond a boundary is treated as confirmation. | Crypto volatility can create fast probes that do not hold. | Check whether later behavior remains accepted beyond the boundary. |
| A thin-token move is treated like a major-coin structure. | Lower liquidity can make patterns look cleaner or more dramatic than they are. | Consider whether the structure depends on shallow participation. |
| A stock-session pattern is copied directly into crypto. | Many chart examples assume regular-session behavior. | Account for continuous trading and weekend or regional liquidity windows. |
| A pattern name is treated as a prediction. | Pattern labels can sound more certain than the chart actually is. | Use the label to organize scenarios, then check whether behavior supports or rejects the structure. |
| A cheat-sheet label replaces structural review. | Visual references are fast, but they can flatten important context. | Move from visual family to the specific pattern only after the structure is clear. |
Crypto vs Stock Chart Pattern Context
The same broad pattern families can appear in crypto and stocks, but the surrounding conditions differ. Stocks often have defined sessions, earnings dates, exchange hours, and clearer venue structure. Crypto trades across multiple venues with continuous activity, fast liquidity shifts, and strong weekend or overnight movement.
That does not make crypto chart patterns useless. It means the reading needs more caution around boundary behavior and participation quality. A structure that looks stable on a liquid major asset may be less stable on a smaller token. A move that looks like completion on one exchange may be less clear when broader venue behavior is checked. A sharp move after a liquidation burst may need more evidence before the pattern label is treated as structurally supported.
Limits of Chart Patterns for Crypto
Crypto chart patterns cannot remove uncertainty. They can help organize what the chart is doing, but they do not predict price direction by themselves. Any reading can weaken if liquidity changes, the market rejects a boundary, the structure becomes too distorted, or later behavior no longer supports the original label.
Core limitation: A crypto chart pattern is only useful when the structure, context, and later behavior support the same reading. If the pattern depends on one wick, one thin move, or one isolated venue print, the label should remain tentative.
A safer reading is structural and conditional. A pattern can describe compression, rejection, narrowing movement, repeated testing, or sharp reversal behavior. It should not be treated as a standalone signal, success-rate claim, or instruction.
FAQ
Are chart patterns for crypto different from stock chart patterns?
The broad visual families can be similar, but crypto markets trade continuously and can show more wick-heavy movement, venue fragmentation, and sharp volatility bursts. That changes how carefully the pattern boundary and later acceptance should be checked.
Why do crypto chart patterns fail?
Crypto chart patterns can fail when a visual label forms before the structure is actually accepted. A brief wick, thin liquidity move, or volatility burst can make a pattern look complete even though later behavior rejects the reading.
Should crypto traders use chart pattern cheat sheets?
A cheat sheet can help identify broad visual families, but it should not replace structural review. The important step is moving from a visual label to a check of context, boundary behavior, liquidity, and follow-through.
Do chart patterns predict crypto prices?
No. Chart patterns organize possible scenarios; they do not predict outcomes by themselves. The reading remains conditional and can weaken if later behavior rejects the structure.
Do chart patterns work the same way on major coins and smaller tokens?
Not always. Major coins usually have deeper participation, while smaller tokens can be more affected by thin liquidity, sharper wicks, and fragmented activity. The same visual structure may therefore need different caution depending on the asset and venue behavior.