A Renko trading strategy is a structured way to interpret Renko bricks, brick size, trend context, confirmation, invalidation, and risk before evaluating a setup. The bricks can help organize price movement, but they are not automatic buy or sell signals.
A Renko-based setup should be judged by the construction rule, the market condition, the visible structure, and the risk boundary. The last brick matters only when it fits a broader decision framework that also accounts for hidden price movement and setting sensitivity.
Key Points
- Renko charts are built from price movement thresholds, not fixed time intervals.
- Brick size controls how much movement must occur before a new brick appears.
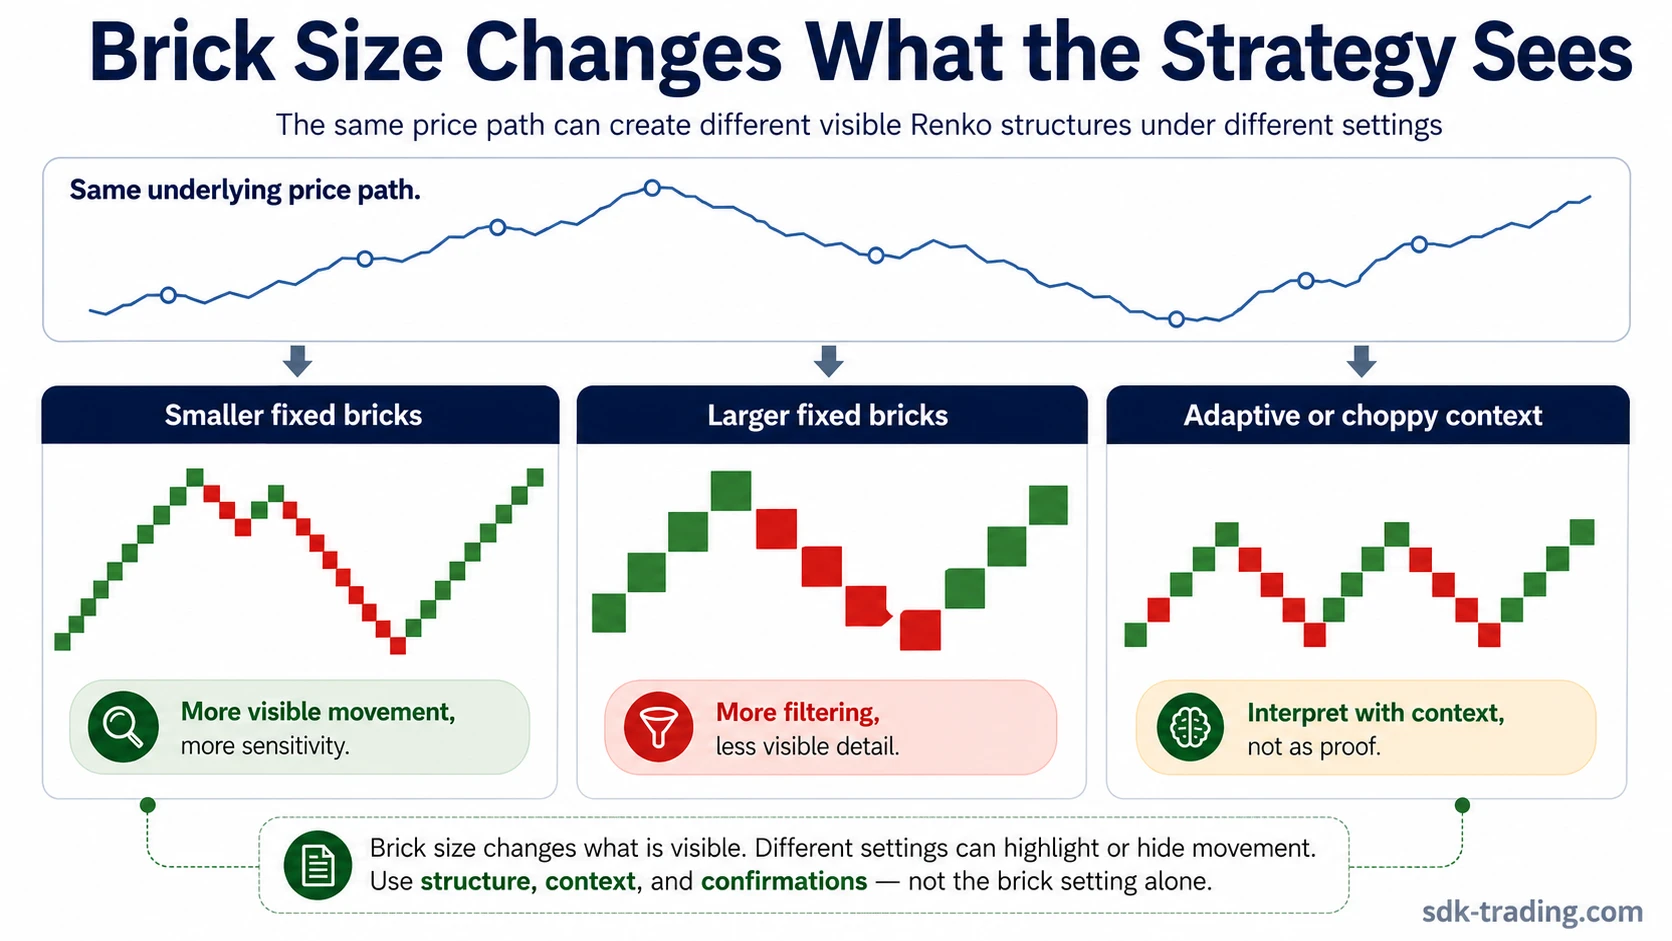
- Smaller bricks show more movement but can create more noise; larger bricks filter more movement but can hide useful detail.
- A Renko reversal brick only shows that the selected construction rule was satisfied.
- A safer Renko strategy separates construction, market condition, confirmation, invalidation, and risk handling.
What Is a Renko Trading Strategy?
Definition: A Renko trading strategy is a decision framework that uses Renko chart structure to organize price movement, filter some smaller fluctuations, and evaluate trend, reversal, or consolidation context. It should be treated as chart-reading logic, not as a standalone trading system.
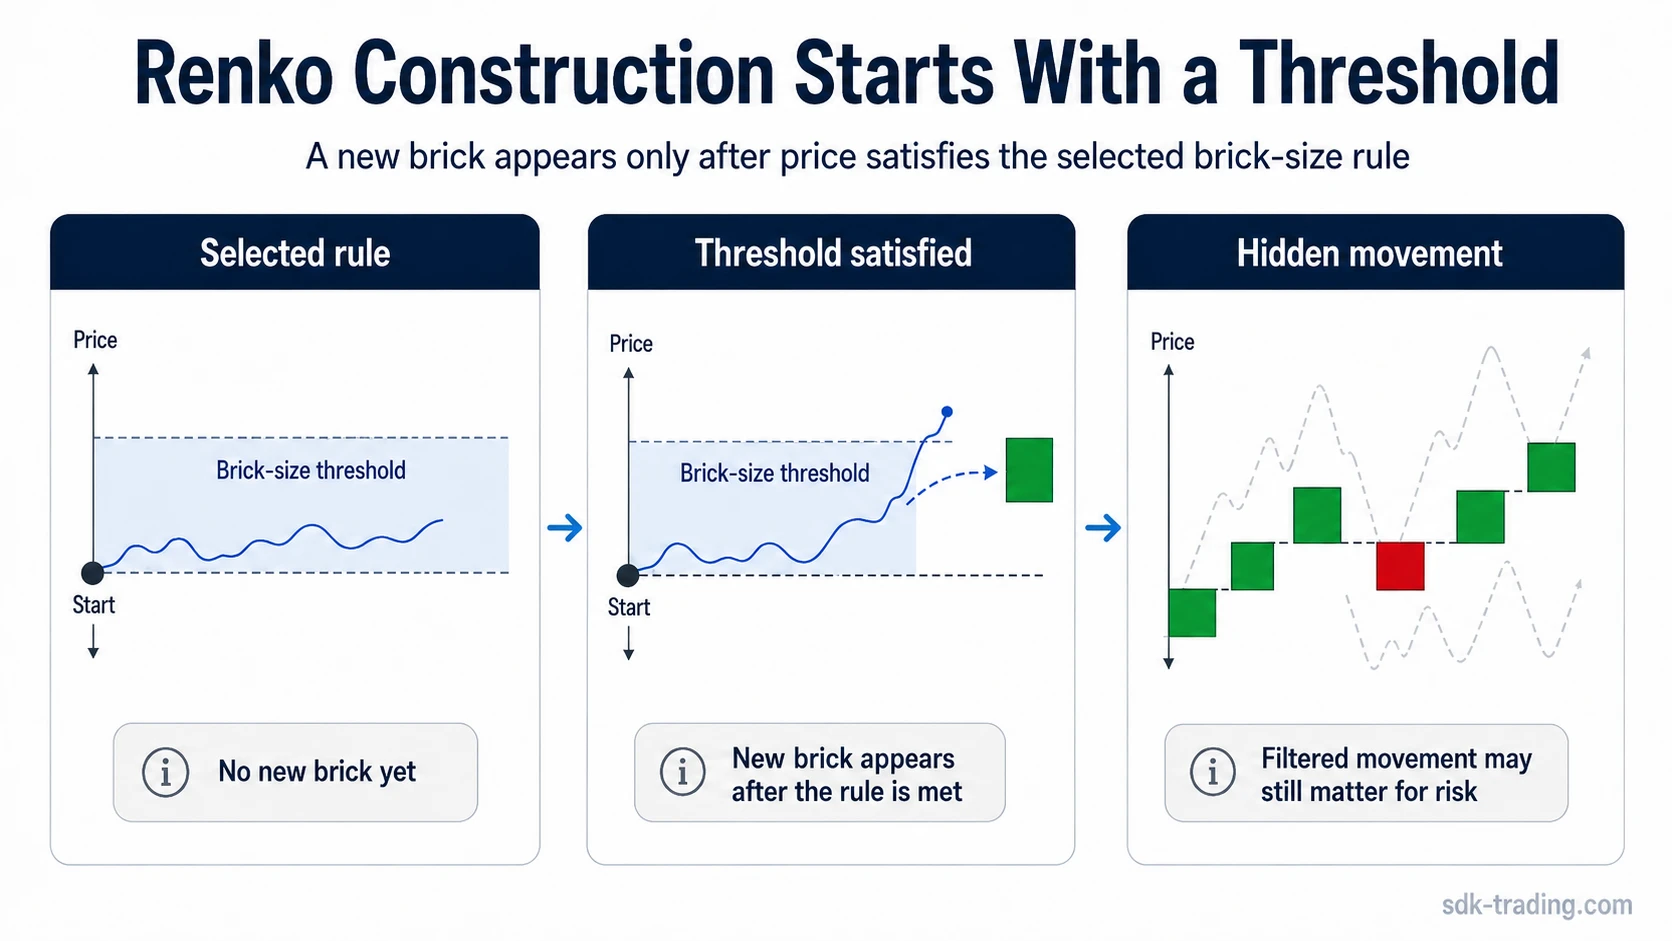
A Renko chart plots new bricks only after price satisfies the selected brick-size rule. That can make direction easier to see, but it also changes what the trader sees. Time, intrabrick movement, and some smaller price swings may disappear from the visible chart.
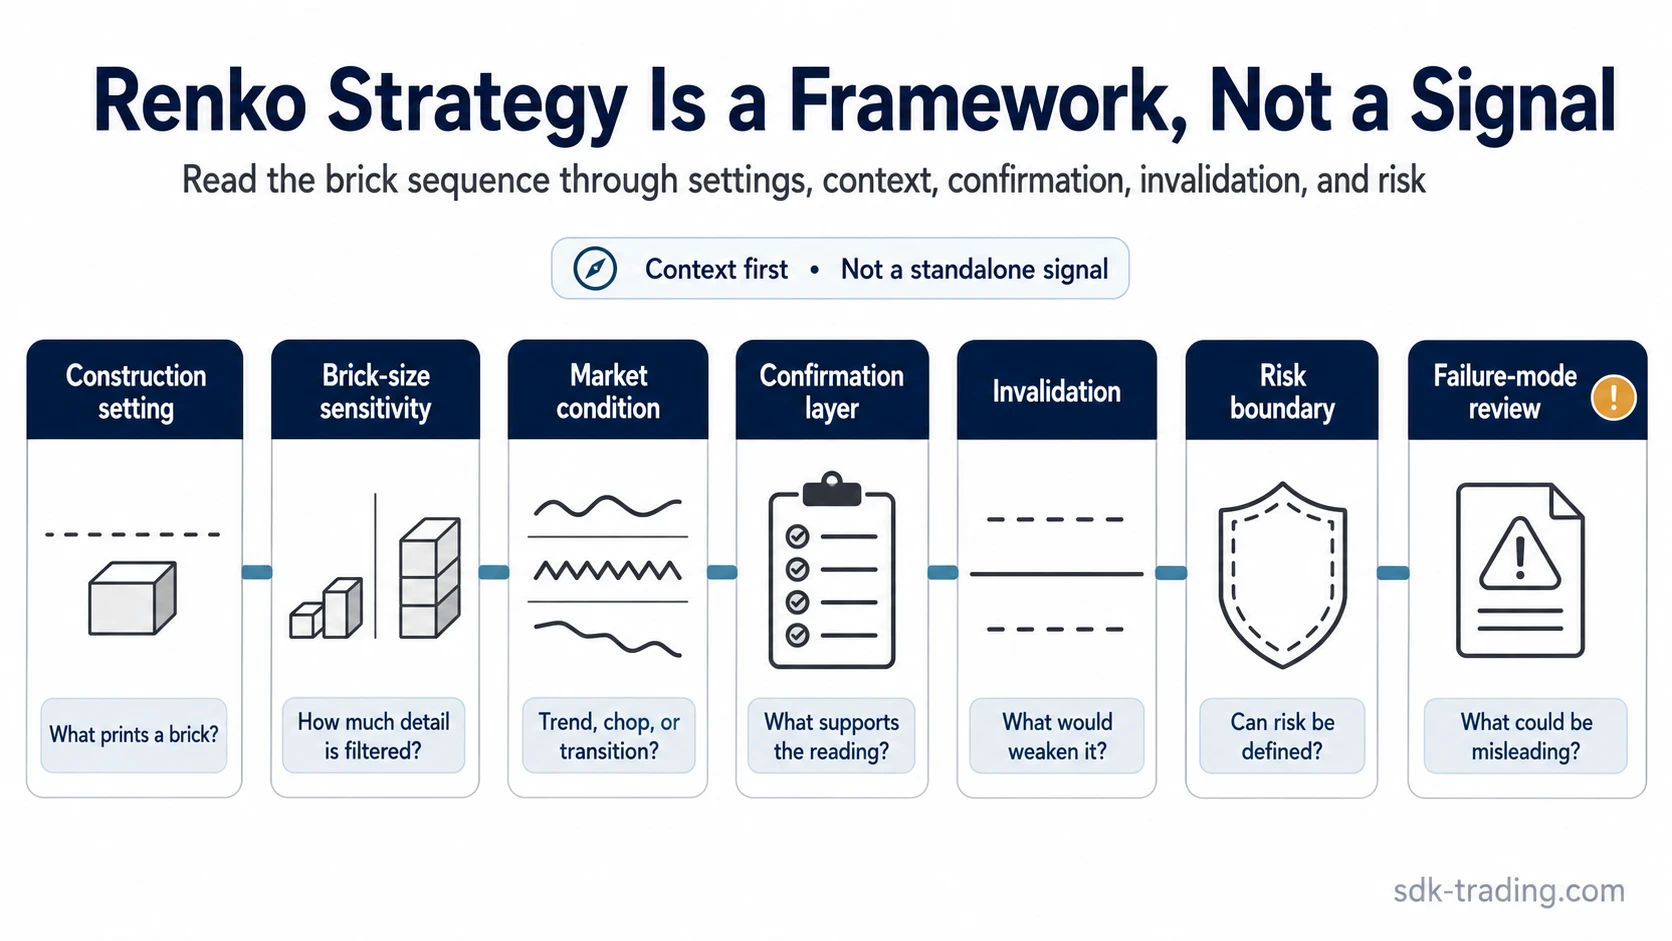
A Renko strategy therefore needs more than a sequence of bricks. It needs a construction setting, a market-condition filter, a confirmation layer, an invalidation condition, and a risk boundary. Without those parts, the chart can look clean while the decision process remains weak.
How Renko Construction Changes a Strategy
Renko construction changes a strategy because the chart does not print every time interval. A new brick appears only after price moves enough to satisfy the selected threshold. Until that threshold is met, price movement can exist without creating a new visible brick.
Renko can simplify visible direction, but the simplification is created by filtering. Filtering can clarify structure and remove detail at the same time.
A clean Renko sequence can create false confidence. A trader may see a smooth series of bricks and assume the move was orderly, even though the underlying price path may have included pullbacks, volatility, spread changes, or failed attempts that the Renko display does not show.
The decision framework should account for that missing detail. A Renko-based idea is stronger when the visible brick sequence agrees with broader structure, prior levels, volatility conditions, and a clear invalidation point. It is weaker when the only argument is that the last brick changed color or direction.
How Renko Brick Size Changes the Strategy
Renko brick size controls the amount of price movement required before the chart prints a new brick. This setting changes the visible structure, the number of bricks, the apparent smoothness of the trend, and the timing of reversals.
| Brick-size choice | What it changes | Strategy risk | Safer interpretation |
|---|---|---|---|
| Smaller fixed bricks | More bricks appear from smaller price movement. | The chart may react to noise and create more alternating bricks. | Use only if the extra detail improves context instead of encouraging overreaction. |
| Larger fixed bricks | Fewer bricks appear because more price movement is required. | The chart may hide useful pullbacks or delay visible reversals. | Check whether the filtered view still leaves enough information for risk and invalidation. |
| ATR or adaptive bricks | Brick size may adjust with volatility settings. | The chart can change its sensitivity as conditions change. | Review how the adaptive rule affects historical appearance before relying on a reading. |
There is no universal best Renko brick size. A setting that makes one market look clear may over-filter another market or under-filter a choppy one. Brick size should be evaluated as a visibility rule, not as a shortcut to a better signal.
Reading Trend, Chop, and Reversal on Renko Charts
A Renko sequence can make directional structure easier to organize. Consecutive bricks in one direction can show that price has continued to satisfy the selected movement rule. That can help separate directional movement from smaller fluctuations that would appear on a time-based chart.
The risk is that the same visual clarity can hide uncertainty. Alternating bricks, stalled sequences, and frequent reversals can reflect choppy conditions, especially when the brick size is too small for the current volatility environment. In that setting, the visible chart may create activity without improving decision quality.
A reversal brick also needs careful interpretation. It shows that price moved enough in the opposite direction to satisfy the construction rule. It does not prove that a new trend has started, that an entry is valid, or that the previous structure has failed.
Limitation: Renko removes some visible noise, but it can also remove information that matters for execution, risk, and context. A filtered chart should not be treated as a complete record of market behavior.
Renko Strategy Framework Components
A Renko strategy framework is stronger when each part of the decision is separated. The chart construction setting decides what becomes visible. The market condition decides whether the structure is likely to be meaningful. Confirmation, invalidation, and risk decide whether the idea is usable.
| Framework component | Question to answer | Why it matters |
|---|---|---|
| Construction setting | What brick-size rule creates the chart? | The visible pattern depends on the selected rule. |
| Market condition | Is the market trending, ranging, or choppy? | Renko readings can weaken when price alternates without progress. |
| Structure | Where are the prior swing areas, congestion zones, or failed moves? | The brick sequence needs context beyond the last brick. |
| Confirmation | What would support the interpretation? | Confirmation reduces dependence on a single brick change. |
| Invalidation | What would prove the reading wrong? | A strategy needs a failure condition before risk is taken. |
| Risk boundary | Can the risk be defined before the idea is judged? | A clean chart does not matter if risk cannot be controlled. |
This framework keeps Renko interpretation from becoming a mechanical rule. A brick sequence can support a scenario, but the scenario remains incomplete until the trader defines what confirms it, what invalidates it, and what risk is acceptable.
Confirmation and Invalidation in a Renko Strategy
Confirmation in a Renko strategy should not mean that a brick has changed direction. A stronger confirmation layer asks whether the new brick agrees with the broader structure, whether the move accepts beyond a relevant area, and whether the same interpretation remains reasonable when hidden movement is considered.
Invalidation is equally important. A Renko reading weakens when the chart alternates repeatedly, when the selected brick size no longer fits volatility, when price fails to continue after the visible break, or when the underlying market condition no longer supports the original scenario.
Confirmation asks what supports the interpretation. Invalidation asks what would make the interpretation wrong. A strategy needs both before the chart pattern can be useful.
This matters because Renko can make reversal and continuation structures look cleaner than they feel in real time. Without a defined invalidation condition, a trader may keep adjusting the interpretation after each new brick instead of recognizing that the original scenario has failed.
Renko Backtesting Risks
Renko backtesting needs special caution because completed bricks can make the historical chart look cleaner than live decision-making would have been. If a test assumes perfect knowledge of completed bricks, it may overstate how clear the setup was at the time.
A backtest can also be distorted by brick-size selection. Choosing a setting after reviewing the outcome can create a curve-fit chart that looks strong in hindsight but does not represent a stable decision process. This risk is higher when the strategy depends heavily on a specific brick size or reversal pattern.
Backtesting caution: Renko backtests should account for information timing, fill assumptions, slippage assumptions, and hidden intrabrick movement. A historical Renko strategy can appear more tradable than it would have been in live conditions.
A safer backtest review asks whether the tested rules could have been known at the time, whether fills were realistic, whether the brick-size setting was selected after seeing the result, and whether the strategy still makes sense when tested against different market conditions.
Practical Renko Strategy Scenario
Imagine price is moving upward overall, but the path includes pauses and pullbacks. With smaller bricks, the Renko chart may show more detail and more alternating bricks, which can make the setup look active but noisy. With larger bricks, the same price behavior may look smoother, but some pullbacks and early weakening signs may be hidden. In a choppy condition, the same settings may produce repeated reversals without useful directional progress.
The lesson is that the Renko setting changes the visible story. A trader who sees only a clean brick sequence may underestimate the movement that occurred inside or between bricks. A trader who uses a very sensitive setting may overreact to structure that is not meaningful enough.
The strategy question is not whether the Renko chart looks clean. The better question is whether the construction rule, market condition, confirmation, invalidation, and risk boundary all point to the same interpretation.
Common Mistakes With Renko Trading Strategies
| Mistake | Why it creates risk | Safer interpretation |
|---|---|---|
| Treating every new brick as a signal | A new brick only means the construction rule was satisfied. | Read the brick inside trend, chop, confirmation, and invalidation context. |
| Choosing brick size after seeing the outcome | Changing the setting after the fact can make history look cleaner than it was. | Define the visibility rule before judging the setup. |
| Ignoring hidden price movement | The Renko display can hide volatility, pullbacks, or failed attempts inside the brick path. | Remember that Renko is a filtered view, not the full price record. |
| Trusting backtests without execution realism | Historical bricks can imply cleaner timing than live trading allows. | Check fill assumptions, information timing, slippage, and setting sensitivity. |
| Turning indicators into a fixed recipe | An indicator stack can create false certainty without improving decision quality. | Use indicators only as optional context, not as mechanical proof. |
How Renko Fits With Other Non-Time-Based Charts
Renko is one way to filter price movement into a non-time-based structure. It focuses on brick thresholds. A Kagi chart uses directional line changes and reversal rules. A line break chart uses closing-price rules against prior lines. A point and figure chart uses X and O columns with box and reversal settings.
The shared lesson is that construction rules shape interpretation. These chart types can reduce some time-based noise, but each one also filters information differently. A trader should understand the rule that creates the chart before treating any visible pattern as meaningful.
Renko also differs from candlestick and Heikin Ashi views. Candlesticks preserve time-period open, high, low, and close structure. Heikin Ashi smooths candle appearance through averaging. Renko removes fixed time intervals from the visible structure and organizes movement through brick thresholds. None of these views is universally better; each answers a different chart-reading question.
FAQ
Is a Renko trading strategy good for every market?
No. A Renko strategy can help clarify directional structure, but choppy conditions, poor brick-size choices, and hidden price movement can make the reading misleading.
What brick size should be used for a Renko strategy?
There is no universal best Renko brick size. Smaller bricks are more sensitive and show more movement, while larger bricks filter more movement and can hide important detail.
Does a Renko reversal brick confirm a trade?
No. A reversal brick only shows that price satisfied the selected construction rule. Broader structure, confirmation, invalidation, and risk limits still matter.
Why can Renko backtests be misleading?
Renko backtests can be misleading when completed bricks are treated as if live decisions were available with perfect timing. Look-ahead bias, unrealistic fills, and hidden intrabrick movement can distort the result.
Is Renko better than candlestick charts?
Not universally. Renko can filter some time-based noise, but it removes detail that candlestick charts preserve. The better chart depends on what the trader needs to evaluate.