Technical indicators for day trading are most useful when they are matched to the same-session problem being measured: trend strength, smoothing, momentum, volatility, participation, or session reference. The common mistake is looking for one best indicator instead of checking whether the tool fits the speed, noise, and decision window of the intraday market.
Definition: Technical indicators for day trading are chart-based tools used to interpret intraday price, volume, volatility, trend, or participation conditions. They do not remove uncertainty; they organize what the trader is trying to measure inside a compressed trading session.
Key Points
- The useful starting point is the intraday question, not the popularity of an indicator.
- Indicators from the same family often repeat the same evidence instead of adding a new read.
- Same-session volatility, liquidity timing, and execution friction can distort otherwise familiar indicator readings.
- Moving averages, trend-strength tools, momentum tools, volatility tools, volume tools, and breadth tools solve different problems.
Why One “Best” Indicator Is the Wrong Starting Point
A day trader who asks for the best indicator is usually asking a broader question: which tool helps interpret the next decision window without adding noise? That answer changes with the market condition. A trend-strength tool is useful for a different problem than a momentum oscillator, a volatility band, or a breadth measure.
The same indicator can also behave differently across the session. A reading that looks meaningful during the opening drive may be less useful during a slow midday range. A threshold that appears stretched during a quiet session may remain stretched during a one-sided trend. The indicator is only one layer; the session environment decides how much weight the reading deserves.
Match the Indicator Family to the Intraday Problem
Intraday indicator selection becomes clearer when the tool is grouped by job. The goal is not to stack more indicators on the chart, but to avoid using three tools that measure the same condition while ignoring the condition that actually matters.
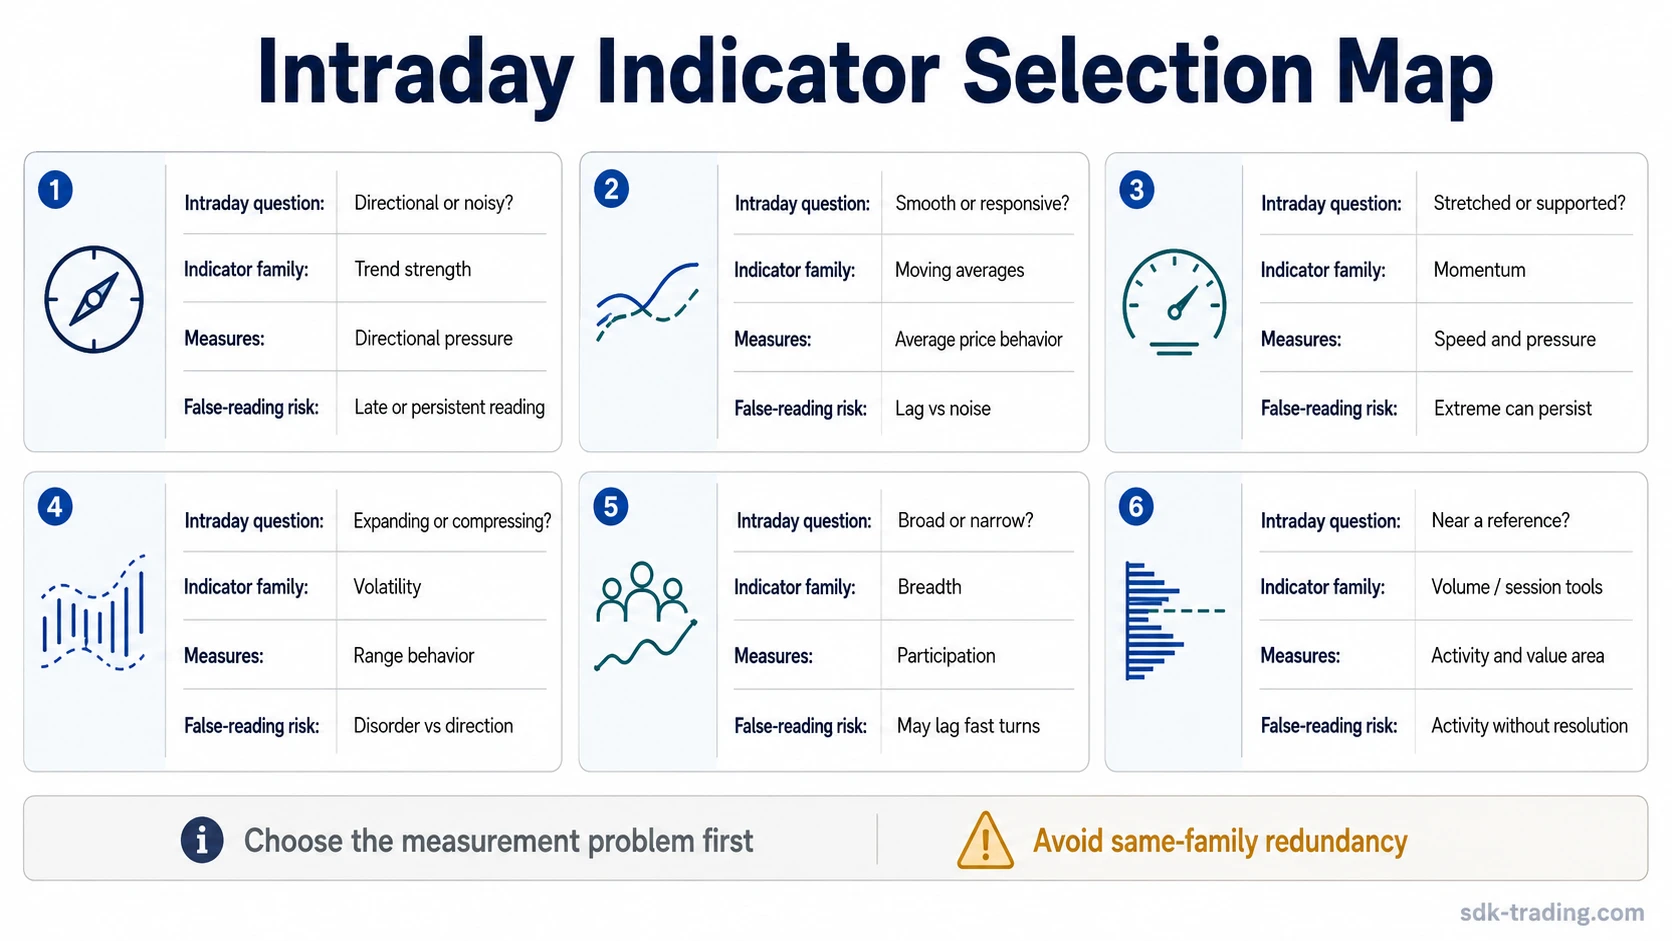
| Intraday question | Indicator family | What it measures | False-reading risk | Related concept |
|---|---|---|---|---|
| Is the move directional or only noisy? | Trend strength | Strength of directional pressure, not direction by itself | A low reading can appear before expansion; a high reading can persist after a move is already extended | Trend strength |
| How smooth or responsive should the average be? | Moving averages | Average price behavior over a selected lookback | Too much smoothing can lag; too little smoothing can react to noise | Responsive moving averages |
| Is price stretched relative to recent behavior? | Momentum and oscillator tools | Speed, pressure, or relative position within a range | Extreme readings can stay extreme during a strong one-sided session | Momentum confirmation or threshold caution |
| Is the session expanding or compressing? | Volatility tools | Range expansion, range contraction, or changing movement size | Volatility expansion can reflect disorder rather than clean directional intent | Volatility context |
| Is participation broad or narrow? | Breadth and participation | Whether movement is supported by more than a single chart or narrow group | Broad measures can lag fast intraday turns and may not match a single instrument | Market participation breadth |
| Is price reacting around a session reference? | Volume, session, or reference-level tools | Where activity, participation, or accepted value may be concentrated | A reference level can attract activity without resolving direction | Session reference context |
Common Mistake -> Better Indicator Family
The fastest way to reduce indicator overload is to translate the mistake into the measurement problem underneath it. More tools do not create better evidence when they are all reacting to the same input.
A cleaner indicator stack separates independent questions: what price is doing, whether directional pressure is building, whether volatility is changing, and whether participation supports the read.
| Common mistake | What it usually means | Better indicator family | Safer interpretation |
|---|---|---|---|
| Adding several moving averages until one looks useful | The chart is being tuned to past movement | Smoothing and responsiveness | Choose whether baseline smoothing, speed, or weighting is the actual need |
| Reading every oscillator extreme as a turning point | Momentum is being treated as reversal evidence | Momentum plus session context | Check whether the market is ranging, trending, or one-sided before giving weight to the threshold |
| Using indicators that all rise and fall together | The setup has redundant evidence, not independent confirmation | Different measurement families | Pair trend, volatility, participation, or volume context only when each adds a separate read |
| Switching indicators after every false read | The tool is being blamed for a market-condition mismatch | Condition-first selection | Start with the intraday problem, then choose the indicator family that measures it |
| Treating a fast signal as automatically better | Responsiveness is being confused with quality | Lag and noise control | Faster readings can reduce delay while increasing sensitivity to intraday noise |
How Same-Session Conditions Change Indicator Readings
Day trading compresses interpretation. A daily chart can absorb slower confirmation, but an intraday chart often forces decisions while liquidity, volatility, spreads, and participation are still changing. That time compression makes indicator readings more vulnerable to overreaction.
Session volatility can make a normal threshold look extreme. Liquidity timing can make a breakout or reversal reading appear stronger during the open than it would during a quieter period. Execution friction can also matter because a chart reading that looks clean after the candle closes may have been difficult to act on while the move was forming.
Limitation: An indicator reading carries more weight when later price or volume behavior does not immediately contradict it. If price rejects the reading quickly, or if participation does not support the move, the original read loses weight.
Common False Readings in Day Trading Indicators
False readings usually come from a mismatch between the indicator and the condition being measured. The problem is rarely that every indicator is useless. The problem is that lag, threshold behavior, smoothing choice, or same-family redundancy can make the chart look more organized than the market really is.
| False-reading source | How it appears | What to compare before trusting it |
|---|---|---|
| Lag | The indicator turns after most of the move has already occurred | Whether price is still accepting the move or already stalling |
| Threshold misread | An oscillator reaches an extreme and is treated as a reversal warning | Whether the session is balanced or one-sided |
| Same-family redundancy | Several indicators agree because they all measure similar price history | Whether another family adds independent evidence |
| Overfitting | Parameters are changed until the past chart looks cleaner | Whether the setting still makes sense under different volatility conditions |
| Overtrading pressure | Every small reading becomes a reason to react | Whether the reading solves a real decision problem or only adds activity |
Moving Averages and Trend-Strength Indicators
Moving averages are often used in day trading because they simplify noisy price movement. The trade-off is sensitivity. Baseline moving-average smoothing responds more slowly, which can reduce noise but also delay the read.
A faster average can make the chart feel more current, but responsiveness is not the same as reliability. Faster smoothing with reduced lag can help compare responsiveness choices without treating speed as proof of a better signal.
Weighted averages sit between simple smoothing and highly responsive tools. Weighted responsiveness gives more influence to recent prices, which can be useful when the current session is moving differently from the prior lookback.
Trend-strength tools solve a different problem. A moving average can describe direction or smoothing, while ADX-style analysis is more focused on whether directional pressure is strengthening or fading. That distinction matters when a chart appears directional but lacks real expansion.
When the question is whether directional pressure is expanding or fading, ADX-style Trend strength belongs in a different category from moving-average smoothing.
Breadth and Participation Checks
Breadth indicators add a different layer because they look beyond one chart. A single intraday instrument can move sharply while broader participation remains weak. That does not automatically invalidate the move, but it changes the interpretation: narrow participation is different from broad market agreement.
For broader participation context, the percent of stocks above a long moving average can help separate single-chart movement from wider market participation. It is slower than an intraday oscillator, but it answers a different question: whether strength or weakness is spread across a larger group of stocks.
Example of a Threshold Misread in Day Trading
An oscillator reaches an extreme reading during a strong morning advance. The tempting interpretation is that the move is stretched and likely to turn. The incomplete part is the session condition: price keeps holding near the upper part of its range, pullbacks stay shallow, and the next recovery attempt is not immediately rejected.
The reading gains context only after the market stops accepting higher prices or starts showing failed follow-through. If the oscillator stays extreme while price remains one-sided, the threshold may describe momentum pressure rather than a turning point.
Where Indicator Selection Should Start
Start with the condition that needs measurement: direction, smoothing, momentum, volatility, participation, or session reference. A smaller set of indicators is easier to interpret when each tool answers a different question.
The strongest indicator stack is not the one with the most agreement. It is the one that avoids redundant evidence and separates what price is doing from whether trend strength, participation, or volatility supports the same read.
FAQ
What are the most useful technical indicators for day trading?
The most useful technical indicators for day trading depend on the decision problem. A trend-strength tool, moving average, oscillator, volatility measure, volume tool, or breadth measure can answer a different question, so the better choice depends on what the session needs to measure.
Are moving averages enough for day trading?
Moving averages can help simplify noisy intraday price action, but they mainly describe smoothed price behavior. They can miss participation, volatility, and momentum changes when those conditions matter more than trend direction.
Why do day-trading indicators give false readings?
False readings often come from lag, threshold misreads, redundant indicators, parameter overfitting, or a mismatch between the indicator and the session condition. A reading that works in a range can mislead during a one-sided session.
Should beginners use fewer indicators for day trading?
Beginners usually benefit from fewer indicators because each tool should have a clear job. A smaller set makes it easier to see whether the chart is measuring trend, momentum, volatility, participation, or smoothing instead of repeating the same evidence.