A technical indicators list is most useful when the tools are grouped by what they measure, what market condition they help frame, and where their readings can overlap. Many indicators transform price, volume, volatility, momentum, trend, or related market data into chart readings, but a longer list is not a ranking and does not automatically create better evidence.
Definition: Technical indicators are chart-based tools that process market data into visual readings, thresholds, lines, bands, or values. They can organize trend, momentum, volatility, volume participation, smoothing, and structure context, while each reading still depends on the input data and the market condition around it.
Key Points
- Indicator categories are practical groupings, not a universal ranking system.
- Tools that use similar price or smoothing inputs can appear to agree without adding independent evidence.
- The clearest fit starts with the market condition being checked, then selects the indicator type that matches that condition.
What Technical Indicators Measure
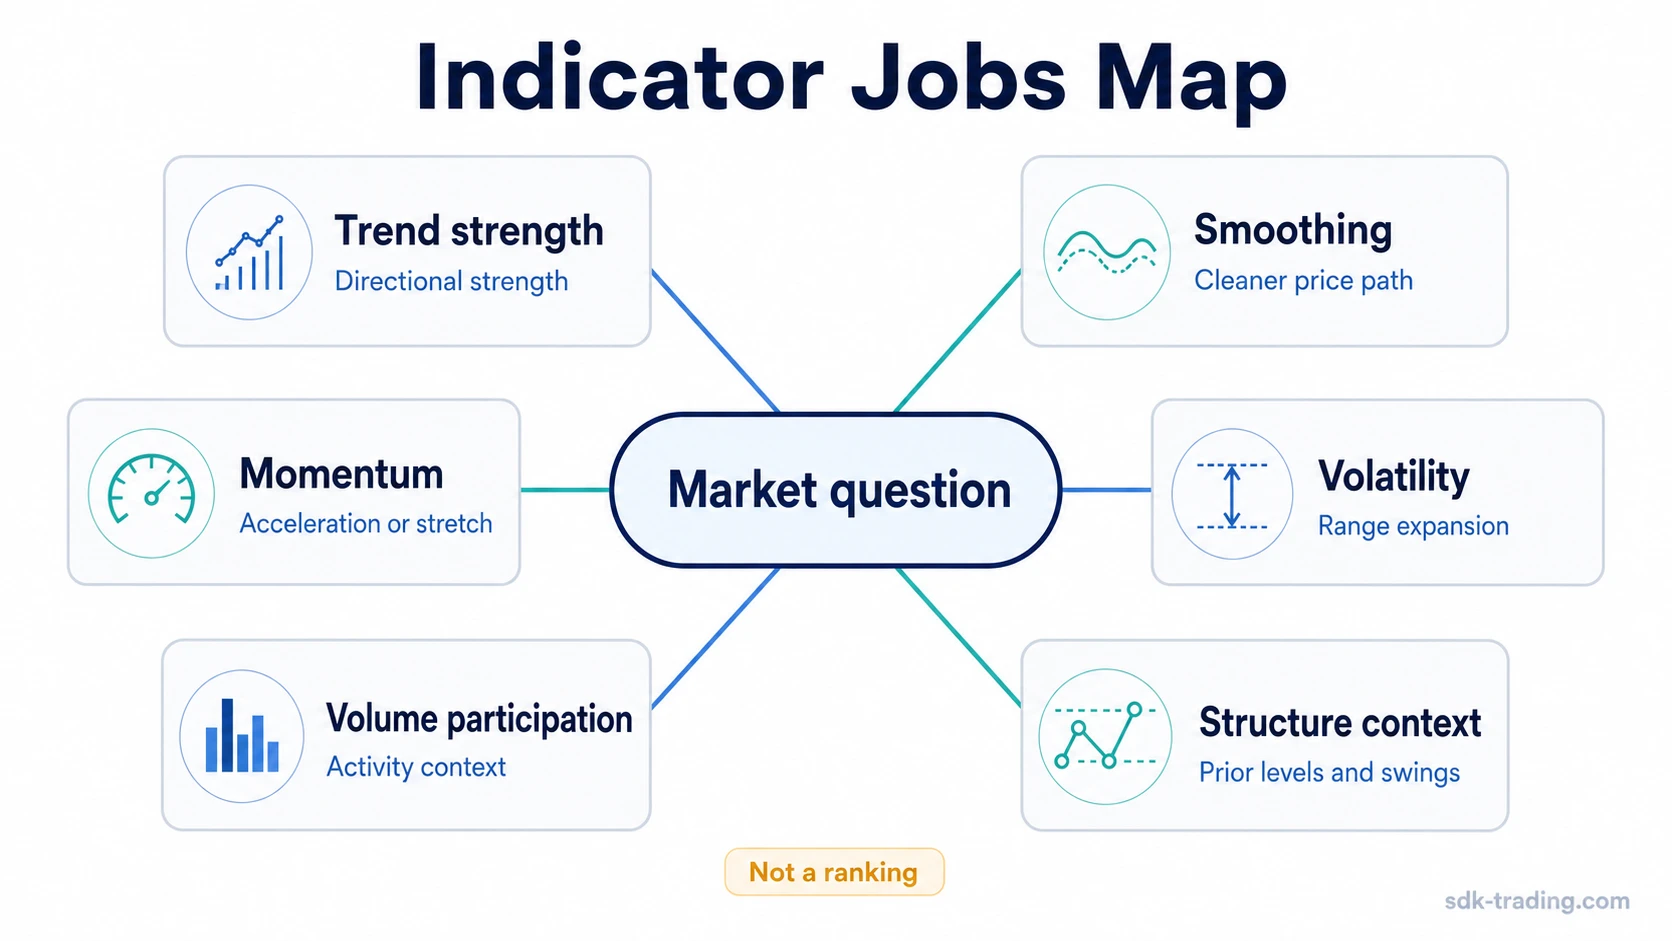
Technical indicators usually reduce market behavior into a narrower reading. A trend tool may focus on direction or directional strength. A smoothing tool may reduce short-term noise. A momentum tool may compare recent movement against earlier movement. A volatility tool may describe range expansion or contraction. A volume-based tool may add participation context.
The category is only the starting point. Two indicators can sit in different visual formats while still depending on similar price movement. A line, band, oscillator, or moving average can look like a separate confirmation layer, but the underlying input may still be close enough to create duplicate readings.
Technical Indicators List by Market Job
Indicator choice should begin with the condition being checked. Trend strength, smoothing, momentum, volatility, volume participation, and structure context are different jobs. Mixing them can be useful when the mix adds different information rather than repeating the same input.
| Market job | Example indicators | Main input | Helps frame | Key limitation | Where it fits |
|---|---|---|---|---|---|
| Trend strength | ADX | Directional movement and range behavior | Whether movement has directional strength rather than only sideways noise | Strength does not identify direction by itself and can lag after expansion | ADX trend strength |
| Baseline smoothing | SMA | Average price over a fixed lookback | A simple reference line for the average price path | Can react slowly when market conditions change quickly | Baseline moving average |
| Responsive smoothing | EMA | Price with more weight on recent data | A faster smoothing method when recent candles need more influence | Can become noisy when price whipsaws around the average | Responsive moving average |
| Weighted smoothing | WMA | Price weighted across the lookback window | A moving-average method that changes the importance of each data point | The weighting method can change the reading without adding a separate market input | Weighted smoothing |
| Low-lag smoothing | HMA | Weighted averages designed to reduce lag | A smoother line that tries to react faster than traditional averages | Lower lag can still create false confidence in choppy conditions | Low-lag smoothing |
| Adaptive smoothing | ALMA | Smoothed price using weighting and offset logic | A smoother average behavior when the focus is cleaner trend visualization | The smooth line may hide how much of the reading still comes from price alone | Adaptive smoothed average behavior |
| Momentum | RSI, stochastic, rate-of-change tools | Recent price change compared with earlier movement | Whether movement is accelerating, stalling, or stretched relative to recent behavior | Thresholds can look decisive even when the broader structure remains unresolved | Best used as a momentum lens, not as a duplicate trend label |
| Volatility | Bands, ranges, volatility envelopes | Range expansion, contraction, or dispersion around price | Whether the market is expanding, compressing, or moving outside a typical range | Volatility describes range behavior, not trade direction by itself | Best used to frame range conditions before interpreting direction |
| Volume participation | Volume overlays, participation measures, accumulation-style tools | Trading activity and price-volume relationship | Whether movement has participation behind it or is occurring on thin activity | Volume needs context from price result, spread, and later behavior | Best used to check effort and result, not to replace structure |
| Structure context | Support and resistance overlays, pivots, market-structure tools | Prior price areas, swings, ranges, and tested levels | Where an indicator reading appears in relation to known market areas | Structure can reframe the same indicator reading as normal, stretched, or unresolved | Best used before treating any indicator value as meaningful |
How to Choose the Right Indicator Type
The strongest starting point is not the longest indicator list. The stronger starting point is a clear market condition to evaluate. If the question is whether movement has directional strength, a trend-strength tool fits better than adding more moving averages. If the question is whether price needs a cleaner reference line, a smoothing tool fits better than forcing a momentum threshold into the decision.
A useful workflow separates the job first, then checks whether the tool adds a different kind of information. A moving average can frame the path of price. ADX can frame whether movement has directional strength. A volatility band can frame range expansion. These are different jobs. The mistake is treating three tools with similar inputs as three independent confirmations.
Smoothing and Trend Strength
Smoothing tools convert price into a cleaner line. SMA, EMA, WMA, HMA, and ALMA all transform price in different ways, but their visual differences do not mean they always provide separate evidence.
Trend-strength tools answer a different question. ADX focuses on directional strength rather than smoothing the price path. Even there, the reading still needs context because a rising strength reading can appear after a move is already extended.
Duplicate Input Risk
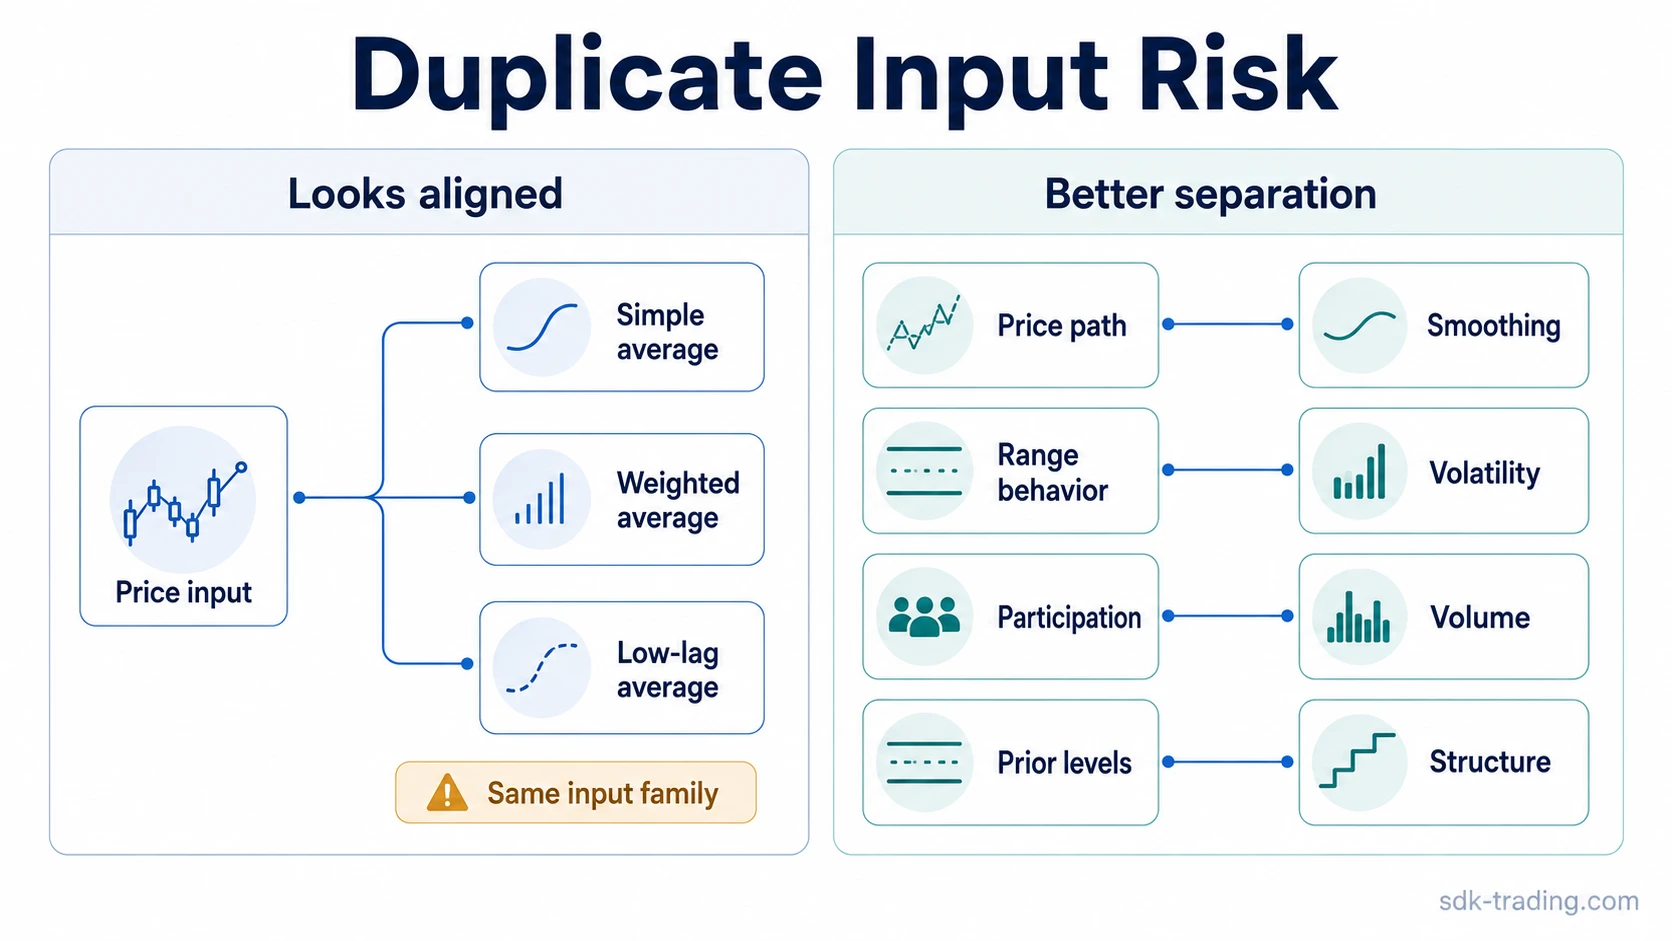
Limitation: Several indicators can appear to agree because they reuse similar price, range, or smoothing inputs. A simple moving average, a weighted moving average, and a low-lag moving average may all respond to the same price movement. Their agreement is not automatically three independent readings.
Duplicate input risk is highest when a chart looks more diversified than it really is. Multiple lines can point in the same direction while most of the evidence still comes from one idea: price moving through the same area and being smoothed in several ways.
That does not make the tools useless. It makes category choice more important. One smoothing tool may be enough for the smoothing job. A separate volume, volatility, or structure check can add a different kind of context when it fits the condition being evaluated.
List, Category, and Ranking Boundaries
Indicator categories are practical groupings, not a fixed hierarchy. A trend-strength tool is not automatically more useful than a smoothing tool. A volatility tool is not automatically more advanced than a moving average. The right category depends on the condition being checked and whether the tool adds information that is not already visible elsewhere on the chart.
| Common drift | Safer interpretation |
|---|---|
| Treating the list as a ranking | Use categories to identify the job each indicator performs. |
| Adding several similar averages | Check whether the extra average adds a new input or only a different smoothing style. |
| Using thresholds without structure | Read thresholds with market context, not as isolated conclusions. |
| Replacing chart context with indicator output | Use indicators to organize evidence, while price behavior and market structure remain part of the read. |
Common Limitations of Indicator Lists
A list can create the illusion of coverage. Ten indicator names may feel more complete than three, but the extra names can still cluster around the same input. The more useful test is whether the list separates jobs: trend strength, smoothing, momentum, volatility, volume participation, and structure context.
A second limitation is threshold misreading. An oscillator threshold, a moving-average cross, or a band touch can look decisive when viewed alone. The reading becomes more useful when the chart also shows what happened around the tested area, whether the move was accepted or rejected, and whether the next attempt confirms or weakens the idea.
A third limitation is parameter dependence. Small changes in lookback length, weighting, or smoothing method can change the output. That does not make the tool invalid, but it means the indicator should fit the market condition rather than being chosen because it looks cleaner after the fact.
Simple Technical Indicators List Example
Price pushes out of a prior range, then several moving averages turn upward after the same price movement has already developed. A simple average, a weighted average, and a lower-lag average may all react to that same movement. The chart can look aligned, but most of the evidence may still come from one input: price moving higher.
A cleaner classification separates the job. If the question is smoothing, one moving-average tool may be enough. If the question is directional strength, a trend-strength reading may add a different lens. If the question is whether participation supports the move, volume context becomes more relevant than adding another average.
FAQ
What is included in a technical indicators list?
A technical indicators list usually includes trend, smoothing, momentum, volatility, volume, and structure tools. The most useful version groups them by market job instead of treating every indicator name as a separate decision tool.
Is a technical indicators list the same as a ranking?
No. A list can organize tools by category, input, and limitation without ranking them. The right tool depends on the market condition and whether the indicator adds information that is not already repeated elsewhere.
Why can similar indicators give the same reading?
Similar indicators often use related price, range, or smoothing inputs. They can appear to agree because they are processing the same underlying movement rather than adding independent evidence.
How many indicators should be checked at once?
The number matters less than the mix of inputs. A smaller set that separates trend, volatility, volume, and structure can be more informative than a larger set built from overlapping smoothing tools.