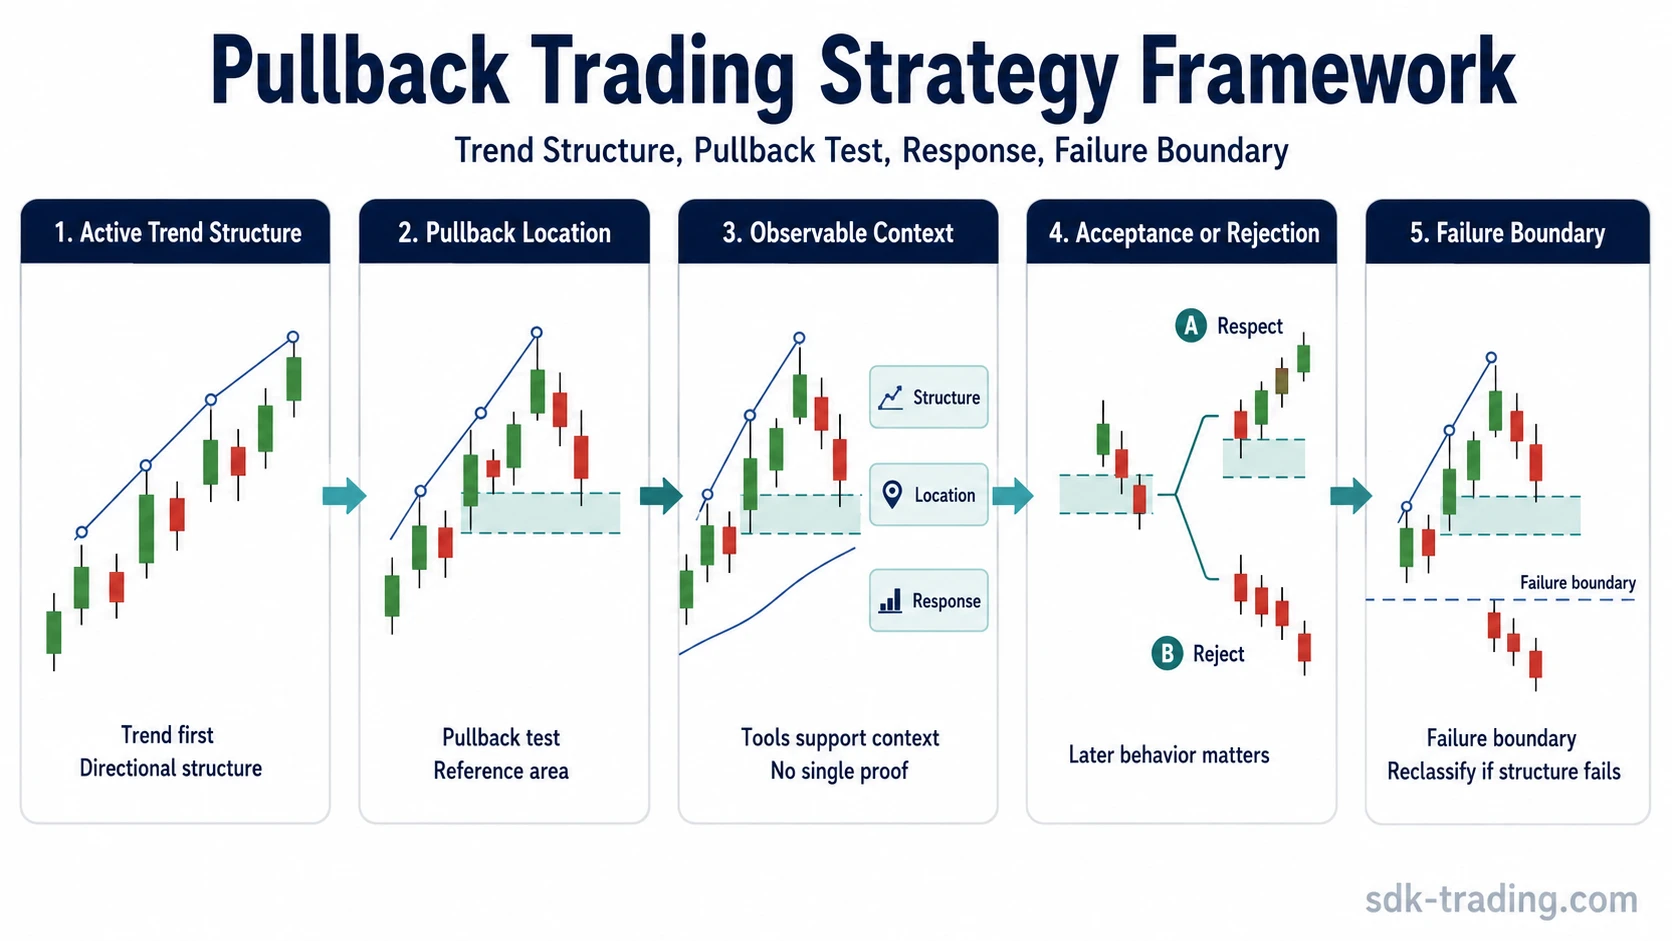
A pullback trading strategy is a conditional framework for reading a temporary move against an active trend. The trend comes first, the pullback is the test, and the next structural response decides whether continuation remains plausible, uncertainty increases, or reversal behavior starts to appear.
Definition: A pullback trading strategy reads a counter-trend pause, dip, or retracement inside an existing directional structure. It is not a standalone instruction to act. The useful question is whether the pullback holds within the active structure or whether the market begins to reject the original trend thesis.
The framework starts with structure rather than with an isolated candle, indicator, or retracement level. A pullback can look clean while the larger trend remains intact, but the same movement can become weaker if the pullback breaks the structure that made the trend readable in the first place.
The strongest use of pullback logic is not to label every dip as opportunity. It is to separate an organized pause from a loss of structure, a failed continuation attempt, or a transition into range behavior.
Key Points
- A pullback trading strategy begins with an active trend or directional structure.
- The pullback is interpreted by location, depth, behavior, and later acceptance or rejection.
- Moving averages, Fibonacci, trendlines, support and resistance, volume, and momentum can support the reading, but none of them proves the pullback interpretation by itself.
- A pullback becomes weaker when structure breaks, momentum stalls, or the market stops respecting the prior trend boundary.
- The framework must stay separate from breakout, reversal, and failed-break structures unless the follow-up structure justifies reclassification.
What Is a Pullback Trading Strategy?
A pullback trading strategy reads the relationship between trend structure and counter-trend movement. In an upward structure, a pullback usually appears as a controlled move lower or sideways against the prior advance. In a downward structure, it usually appears as a controlled move higher or sideways against the prior decline.
The pullback itself is not the whole setup. The structure around it matters more than the label. A shallow pause near a prior breakout area, a deeper retracement into a support or resistance zone, and a choppy move that erases the original structure are different readings even if all three are casually called pullbacks.
The framework works by asking five questions in order: is there an active trend, where did the pullback form, how did price behave inside the pullback, what changed after the test, and what would make the original reading fail?
Trend Structure Comes First
A pullback has meaning only after directional structure exists. Without a prior trend, the same movement may be a range fluctuation, a failed breakout attempt, or noise inside a sideways market.
Trend structure can appear through higher highs and higher lows, lower highs and lower lows, a clean directional channel, repeated respect of a moving average area, or repeated acceptance on one side of a prior support or resistance boundary. The exact tool is secondary. The important point is whether the market has already shown directional organization.
Framework note: A trendline, moving average, or Fibonacci retracement can help mark the area where a pullback is being tested. It should not replace structure. The reading becomes more defensible when price behavior, location, and context agree.
A weak trend produces weak pullback readings. If the market is already choppy, overlapping, and inconsistent, a counter-move may not be a pullback in any useful structural sense. It may simply be part of a range.
Pullback Location and Structure
Location determines whether the pullback is testing a meaningful part of the trend or drifting without a clear reference point. The most useful pullback locations often appear near prior swing areas, trend boundaries, moving average zones, retracement areas, or former support and resistance levels.
A prior resistance area that starts behaving as support, or a prior support area that starts behaving as resistance, can create a useful structural reference. That role change is commonly described as a flip zone, but the zone still needs a follow-up test to show whether it is being respected or rejected.
The shape of the pullback also matters. A controlled pullback usually preserves a visible relationship to the prior trend. A disorderly pullback often overlaps heavily, breaks nearby swing structure, or absorbs the entire prior directional move. The deeper and messier the pullback becomes, the more the original continuation reading needs to be questioned.
Pullback vs Reversal
A pullback and a reversal can begin with similar price movement. The difference is not simply that one is “temporary” and the other is “permanent.” The difference is whether the active trend structure remains intact or fails.
A pullback reading remains more defensible when the counter-move stays within the trend’s normal rhythm, holds above or below the key structural boundary, and the follow-up response does not reject the original directional structure. A reversal reading becomes more relevant when the pullback breaks the structure that supported the trend, fails to recover, and begins building directional pressure the other way.
| Reading | Structure behavior | What changes the interpretation |
|---|---|---|
| Pullback | Counter-trend movement stays connected to the active trend structure. | Later behavior respects the prior structure and does not erase the trend boundary. |
| Weak pullback | The counter-move becomes deeper, slower, or more overlapping than expected. | The trend reading remains possible but loses quality until structure becomes clearer. |
| Potential reversal | The move breaks the structure that made the trend readable. | Later behavior fails to recover the broken area and starts accepting the opposite direction. |
The safer distinction is structural rather than predictive. A pullback is not confirmed by hope that the prior trend will continue. A reversal is not confirmed by the first counter-trend move. The reading changes when structure changes.
Pullback vs Breakout
Pullback logic is different from breakout logic. A breakout starts with movement beyond a defined boundary. A pullback starts after directional movement already exists and then tests whether the market can pause without losing the active structure.
The two concepts can interact. After price moves beyond a boundary, a later return toward that boundary may create a break and retest structure. That is not the same as treating every pullback as a breakout continuation. The boundary, the retest behavior, and the later acceptance or rejection still matter.
Pullback logic also needs separation from a false breakout. A false breakout reading focuses on a failed move beyond a boundary and a return back inside the prior structure. A pullback reading focuses on whether a counter-trend move holds within an existing directional structure.
Simple, Complex, Shallow, and Deep Pullbacks
Pullbacks vary in shape. A simple pullback is usually a clean counter-move with limited overlap. A complex pullback usually has several legs, sideways compression, or repeated tests before the structure becomes readable again.
A shallow pullback may show that the active trend is still being defended quickly, but it can also leave less structural information. A deep pullback may offer a more visible test of the trend boundary, but it also increases the risk that the prior trend structure is being damaged.
| Pullback type | Typical structure | Main interpretation risk |
|---|---|---|
| Simple pullback | One clean counter-move against the active trend. | Reading too much into a move that has not tested a meaningful structure. |
| Complex pullback | Several legs, overlap, or sideways compression. | Calling noise a healthy pause when trend quality is already deteriorating. |
| Shallow pullback | Minor retracement near the prior trend rhythm. | Chasing the prior move instead of waiting for structural clarity. |
| Deep pullback | Large counter-move toward a major trend boundary. | Ignoring that the movement may now be closer to a reversal or range shift. |
The label is less important than the boundary. A pullback remains useful only while the market gives a defensible way to separate continuation structure from failure structure.
Pullback Signal Stack
The signal stack keeps the reading conditional. Each layer should add context. No single layer should be treated as proof.
| Sequence step | What must be true | What weakens the reading | What invalidates the reading | SDK-safe handling note |
|---|---|---|---|---|
| Trend structure | Directional structure exists before the pullback begins. | The trend is already choppy, overlapping, or poorly defined. | The structure that defined the trend breaks and fails to recover. | Start with structure, not with an isolated candle or indicator. |
| Pullback location | The counter-move tests a meaningful area within the trend. | The pullback forms in the middle of noise without a clear boundary. | The test area fails and the market accepts beyond the failure boundary. | Location helps frame the question; it does not answer it alone. |
| Observable context | Trendline, moving average, Fibonacci, support/resistance, or volume context agrees with the structure. | Observables conflict or only one tool supports the reading. | The observable area is broken and follow-through confirms loss of respect. | Tools support context. They do not prove continuation. |
| Later response | Price behavior shows respect, rejection, compression, or renewed structure after the test. | The response is weak, delayed, or inconsistent. | Price accepts outside the area that should have contained the pullback. | Later behavior decides whether the original label still fits. |
| Failure boundary | The structure has a clear point where the pullback reading becomes questionable. | The boundary is vague or constantly moved. | The market breaks the boundary and cannot reclaim it. | The framework needs invalidation to avoid forcing a stale interpretation. |
Observables Used in Pullback Reading
Observables are not mechanical triggers. They are supporting evidence that can make a pullback easier or harder to classify.
| Observable | Useful role | Common misuse |
|---|---|---|
| Moving average area | Shows whether price is testing a commonly watched trend reference. | Treating every touch as proof that the trend will continue. |
| Fibonacci retracement | Marks possible retracement depth relative to the prior move. | Assuming a ratio itself creates support or resistance. |
| Trendline or channel | Frames the rhythm of the directional structure. | Forcing a line to fit a trend that is already broken or unclear. |
| Support or resistance | Shows whether the pullback is testing a prior reaction area. | Ignoring whether price accepts, rejects, or returns through the area. |
| Volume or momentum | Adds context about participation and force behind the pullback or response. | Reading volume or momentum alone without structure and location. |
The best use of these tools is layered. If trend structure, location, and later response all point in the same direction, the reading is cleaner. If they conflict, the pullback label should remain provisional.
Risk Boundary and Invalidation
A pullback framework needs a boundary where the original interpretation becomes weaker or invalid. Without that boundary, the label can become a way to justify any counter-trend movement after the fact.
The boundary may come from a swing low or swing high, a trendline, a channel edge, a prior breakout area, or a support/resistance level. The exact reference depends on the structure being read. The important requirement is that the boundary exists before the interpretation is forced.
Limitation: A pullback is not safer because the word sounds conservative. If the market accepts beyond the structure that was supposed to contain the counter-move, the reading may need to shift toward failed pullback, reversal, range transition, or another structure.
Invalidation is not the same as a trading stop. In this context, it is a structural concept: the point where the original pullback interpretation no longer explains the market behavior well enough.
Failed Pullback Readings
A failed pullback reading appears when the counter-trend move does not behave like a controlled pause inside the active trend. The failure may happen through a direct break of structure, repeated inability to recover the tested area, or acceptance in the opposite direction.
This is where pullback logic can overlap with failed-break and trap concepts, but the terms should not be merged carelessly. A fakey pattern or hikkake pattern depends on inside-range or false-break structure. A failed pullback depends on whether a counter-trend move inside an existing trend loses the structure that kept the pullback reading valid.
The common mistake is to keep calling the move a pullback after the market has already changed the evidence. Once the failure boundary is broken and accepted, the original label should be reviewed rather than defended.
Common Pullback Strategy Mistakes
| Mistake | Why it creates risk | Safer structural reading |
|---|---|---|
| Calling every dip a pullback | The move may be range noise or early reversal behavior. | Check whether an active trend existed before the counter-move. |
| Using one indicator as proof | A moving average touch or retracement level does not prove the market is respecting structure. | Use tools as context alongside price behavior and location. |
| Ignoring depth and overlap | A deep, messy move can damage the structure that made the trend readable. | Compare the pullback with the trend’s prior rhythm and boundary behavior. |
| Confusing pullback with breakout logic | A boundary break and a trend pause answer different structural questions. | Separate continuation inside trend from acceptance beyond a boundary. |
| Moving the failure boundary | The interpretation becomes unfalsifiable. | Define what would make the pullback label no longer fit. |
Example Pullback Reading Scenario
Example: Price has been forming higher highs and higher lows. After a directional move, it drifts back toward a prior breakout area and a rising trend reference. The pullback remains structurally possible while price respects that area and later behavior avoids acceptance below the failure boundary.
The same scenario changes if price breaks the reference area, cannot recover it, and begins accepting below the prior structure. At that point, the useful question is no longer whether the pullback is “good.” The useful question is whether the original trend reading still applies.
This is why the framework should be read as a sequence rather than a label. Trend first, pullback test second, response third, failure boundary last.
How to Keep the Framework Non-Mechanical
A pullback trading strategy becomes more useful when it stays conditional. The framework should help organize evidence, not convert a retracement into an automatic signal.
| Framework question | Cleaner reading | Weaker reading |
|---|---|---|
| Trend | Directional structure exists before the pullback. | No clear trend exists before the counter-move. |
| Location | Pullback tests a meaningful prior area or trend reference. | Pullback forms without a clear structural reference. |
| Depth | Retracement fits the normal rhythm of the trend. | Retracement erases too much of the prior structure. |
| Later behavior | Price respects the tested area and avoids acceptance beyond the failure boundary. | Price accepts through the failure boundary and cannot recover it. |
| Context | Observables support the same structural reading. | Observables conflict or only one indicator supports the idea. |
The goal is not to make the pullback label permanent. The goal is to keep the interpretation responsive to structure, context, and invalidation.