Reversal chart patterns are technical-analysis structures that form after a prior directional move starts to lose continuity and the market begins testing whether control is shifting.
A reversal reading carries more weight when the pattern has a clear prior move, a recognizable tested area, and follow-through that shows whether price holds, reclaims, or fails to sustain the new side of the structure. The shape matters, but the surrounding structure decides how much weight the label deserves.
Definition: A reversal chart pattern is a price structure that may suggest a change from an existing upward or downward movement, but only after the market shows enough context around trend, location, structure quality, and follow-through.
Key Points
- Reversal patterns need a prior directional move; a sideways pause alone is not enough.
- Structure matters more than the pattern name.
- Confirmation is later market behavior around a meaningful area, not the first appearance of a shape.
- Different reversal families behave differently: repeated tests, sharp pivots, rounded transitions, and acceleration breaks should not be treated as the same structure.
- No reversal pattern should be treated as a standalone trading signal.
What Reversal Chart Patterns Mean
Reversal chart patterns describe possible transition zones. They usually appear after a market has already moved in one direction and then begins to show stress, hesitation, failed continuation, or a change in how price behaves around a key area.
The core idea is not that a pattern predicts a new trend. The safer reading is conditional: the prior move has become vulnerable, and subsequent price response helps decide whether the structure is meaningful.
A reversal pattern differs from a continuation pattern because the interpretation questions the existing direction rather than assuming the move is only pausing. A continuation structure usually asks whether the prior direction can resume; a reversal structure asks whether control is transferring to the opposite side or losing enough strength to change the path.
Main Types of Reversal Chart Patterns
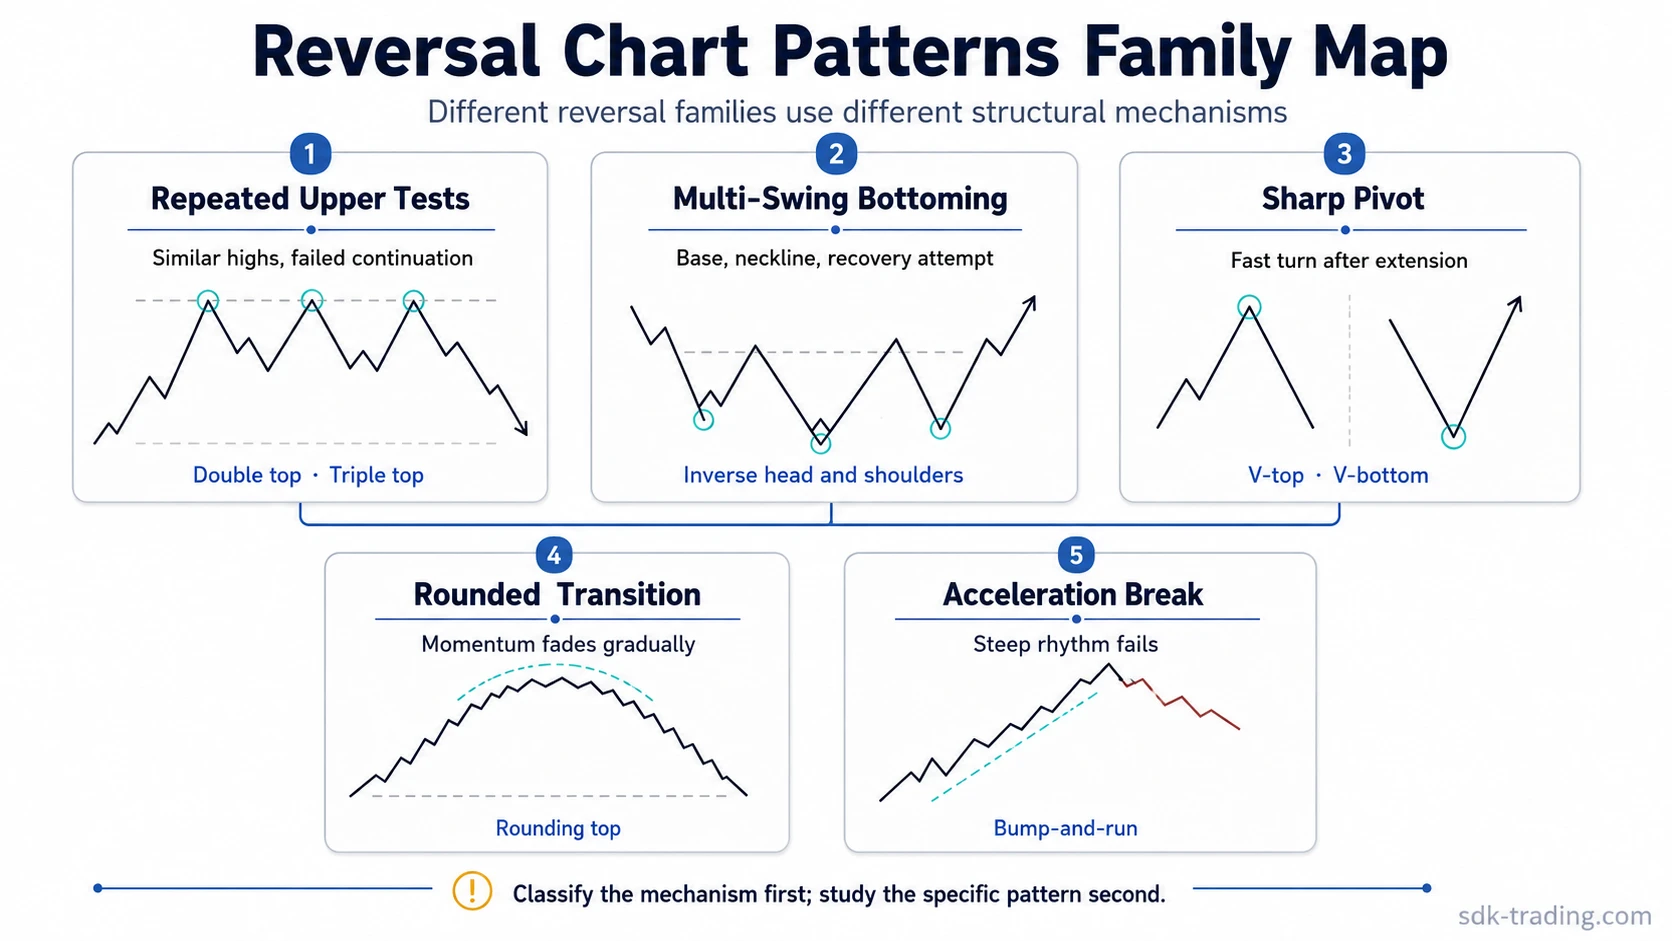
Reversal structures are easier to compare when they are grouped by mechanism rather than ranked as stronger or weaker in isolation. The groups below are not universal rankings; they separate common reversal-pattern families by the chart behavior that makes each family different.
| Pattern family | Typical structure | Pattern examples | Reading focus |
|---|---|---|---|
| Repeated upper-boundary tests | Price returns to a similar resistance area and fails to continue cleanly through it. | Double top structures; triple top formations | Whether repeated tests show absorption, failure to hold higher prices, or a return back below the prior reaction area. |
| Multi-swing bottoming transitions | Several swings form around a base after a decline, with a middle low and later recovery attempt. | Inverse head and shoulders patterns | Whether the neckline area becomes a meaningful boundary after the structure develops. |
| Sharp pivot structures | Price changes direction quickly after an extended move, often with little rounded transition. | V-top reversals; V-bottom reversals | Whether the pivot is only a fast reaction or the start of sustained movement in the opposite direction. |
| Rounded or gradual transitions | Momentum fades over time instead of reversing through one sharp break. | Rounding top structures | Whether the market is slowly losing upside continuity rather than making one clean rejection. |
| Acceleration-break structures | A steep advance becomes extended, then breaks the rhythm that carried the move. | Bump-and-run patterns | Whether the acceleration phase fails and price can no longer maintain the prior slope. |
How Reversal Pattern Families Differ
Repeated-test patterns focus on how price behaves when it returns to a similar area. A double top or triple top is less about the exact number of peaks and more about whether the market fails to sustain higher prices after repeated attempts.
Sharp pivot structures behave differently because the transition is compressed. A V-top or V-bottom can look decisive, but the fast turn also raises the confirmation burden because the first reaction may be only a temporary adjustment.
Rounded structures develop more slowly. The important clue is not one dramatic candle, but a gradual loss of continuity as each recovery or push becomes less convincing.
Acceleration-break structures begin with an unusually steep phase. The reversal question appears when that accelerated rhythm fails and the market can no longer defend the same slope or continuation behavior.
Useful distinction: a reversal pattern name describes the visible structure, while the reading depends on the prior move, the tested area, and the market response that follows.
How to Read Reversal Patterns Without Overreading Them
A reversal label is weakest when it is assigned from shape alone. A clean-looking pattern can still fail if it forms in the wrong location, lacks a meaningful prior move, or receives no follow-through after the key area is tested.
| Reading step | What to check | Why it matters |
|---|---|---|
| Prior move | Was there a clear directional advance or decline before the structure? | Without a prior move, the structure may be a range pattern rather than a reversal pattern. |
| Location | Did the pattern form near a meaningful support, resistance, trend, or prior reaction area? | Location gives the structure context and reduces random shape-matching. |
| Tested area | How did price behave around the neckline, resistance area, support area, or slope break? | The tested area is where failed continuation, reclaim attempts, or sustained pressure becomes visible. |
| Volume and context | Did activity expand, dry up, or remain neutral around the tested area? | Volume can add context, but it should not override price structure by itself. |
| Follow-through | Did price hold the new area, reclaim the old area, or remain unresolved? | Follow-through helps separate a developed reversal reading from an early guess. |
Example of a Basic Reversal Pattern Reading
Price advances into a prior resistance area, pulls back, returns to a similar high, and then fails to hold above that area. The repeated test may suggest a double-top-style structure, but the reading is incomplete until the next response shows whether price remains below the tested area or quickly reclaims it.
If price later holds below the trough area after the second test, the reversal interpretation becomes more defensible. If price returns above resistance and stays there, the earlier structure weakens and may become a failed reversal attempt.
Common Misreads in Reversal Chart Patterns
Common mistake: naming the pattern before the structure supports the label. A few similar candles or swings can resemble a reversal pattern before the market has shown enough behavior around the tested area.
| Misread | Why it causes problems | Safer interpretation |
|---|---|---|
| Calling any pause a reversal | A pause can be consolidation, absorption, or temporary hesitation. | Look for a prior move, a structural area that matters, and a clear response around that area. |
| Treating one wick as confirmation | A wick may show rejection, but it does not prove sustained movement elsewhere. | Compare the wick with the next recovery attempt or the next test of the same area. |
| Ranking patterns as universally strongest | The same pattern can behave differently across trend, volatility, and market context. | Judge the structure by location, clarity, and follow-through instead of a universal ranking. |
| Ignoring failed acceptance | A pattern can appear valid briefly and then lose its meaning when price reclaims the prior area. | Treat failed acceptance as important information, not as an inconvenience to the original label. |
Reversal vs Continuation vs Candlestick Reversal Patterns
Reversal chart patterns and continuation chart patterns both use price structure, but they ask different questions. Reversal structures question whether the existing move is losing control. Continuation structures ask whether the existing move is pausing before attempting to continue.
Candlestick reversal patterns are usually smaller units. A single candle or two-candle pattern may help interpret timing or rejection, but a chart-pattern reversal normally depends on a broader structure with swings, key areas, and follow-through.
| Category | Main question | Typical evidence |
|---|---|---|
| Reversal chart pattern | Is the prior move losing continuity or control? | Prior trend, key-area test, failed continuation, and subsequent market response. |
| Continuation chart pattern | Is the prior move pausing before continuation? | Consolidation, controlled pullback, breakout attempt, and sustained movement in the prior direction. |
| Candlestick reversal pattern | Is a smaller rejection or hesitation appearing at a specific point? | Candle body, wick, close location, and nearby structure. |
When a Reversal Reading Remains Unresolved
A reversal pattern can remain unresolved even after a recognizable shape appears. The structure may need more information if price is still rotating around the same area, if volume context is unclear, or if the market has not sustained movement away from the tested zone.
Unresolved does not mean useless. It means the chart has raised a question but has not yet supplied enough behavior to answer it. In that situation, the most useful step is classification: repeated tests, sharp pivots, rounded transitions, and acceleration breaks each point to a different pattern family.
Limitation: reversal patterns are interpretation tools. They can help organize chart behavior, but they do not remove uncertainty and should not be converted into mechanical predictions.
FAQ
What are reversal chart patterns?
Reversal chart patterns are price structures that appear after a prior directional move and may show that the existing move is losing continuity. The reading depends on context, structure quality, and follow-through around the tested area.
What are the main types of reversal chart patterns?
Main types include repeated boundary tests, multi-swing transitions, sharp pivot structures, rounded transitions, and acceleration-break structures. Examples include double tops, triple tops, V-tops, V-bottoms, inverse head and shoulders, rounding tops, and bump-and-run patterns.
How are reversal chart patterns confirmed?
A reversal reading becomes more defensible when later price behavior supports the structure around a meaningful area. A shape alone is not enough; follow-through and the market response around the tested area matter.
Are reversal chart patterns reliable?
Reversal chart patterns are not reliable as standalone signals. Their usefulness depends on prior trend, location, structure quality, market context, and follow-through. No pattern should be treated as complete evidence by itself.
How do reversal patterns differ from continuation patterns?
Reversal patterns question whether the prior move is losing control. Continuation patterns question whether the prior move is pausing before resuming. The distinction comes from context and follow-through, not from the shape alone.
Choosing the Right Reversal Pattern Family
Start with the structure rather than the label. Repeated resistance tests belong in a different family from a fast V-shaped pivot. A slow topping process belongs in a different family from an acceleration break. A multi-swing bottoming transition needs different evidence from a sharp one-candle reaction.
The practical distinction is simple: classify the mechanism first, then study the specific pattern that matches it. That keeps the reversal reading tied to observable chart behavior instead of forcing every chart into the nearest familiar name.